
By David Dziekanski, Portfolio Manager, and Michael Venuto, CIO
A Tale of Assumptions and Expectations
Less than 18 months past a 2-month truncated recession, it’s always good to step back and think about how investors’ assumptions and expectations have changed. In the depths of March 2020, investors and allocators were happy to just not lose money. Things were changing fast, causing collective FOMO (fear of missing out) from Mega-cap technology, infotech companies (think FAANG), crypto currencies and NFTs, which dislocated return expectations from reality. It’s hard to not feel nervous about this market. Investors have every right to feel nervous, as we navigate our portfolio allocations while experiencing the Federal Reserve’s series of experiments. With magic wands capable of erasing (or truncating) any recession in our sights, the Fed adds more leverage and fuel for the next market dislocation, all while leaving the world of allocators to question if this market is anything but one-directional in the long term. While many joke that the Fed is protecting equity markets, the Fed has really been focusing their actions on bond markets. Muting volatility and interest rates has been the name of the game.
An index that is gaining a lot of popularity as a gauge of volatility in the treasury bond market, called the MOVE Index, does a great job displaying the muted volatility we’ve experienced in treasuries below. We’ve overlayed the MOVE Index, with the FARBAST Index representing the value of all US Federal Reserve Bank Assets. The chart on the left goes back to January 2008. The negative correlation is clear over time, as almost every leg of additional QE results in a decrease of the MOVE Index. The chart on the right is as of 2021. The relationship is breaking down, as the expectation of less Federal Reserve support in the future is affecting volatility in bond markets.

In some senses, investors are both exceptionally fearful and bullish at the same time. In the past we’ve spoken about the echo chamber effect social media has created. The echo chamber’s effects on investing and the psychology of investing are just starting to be understood. Actions taken by the Federal Reserve have inflated almost all assets, leaving most echo chambers feeling confident in their investment prowess. Expectations that the Fed will always be there to save drawdowns, and investors proving confidence in buying beaten down assets, has left us in a world where one has to question if the type of market dislocations we’ve experienced in the past are actually of the past. The truth? It is not, but the façade expectations and assumptions built around it can lead markets to unimaginable highs, for much longer than most investors can fight that FOMO.
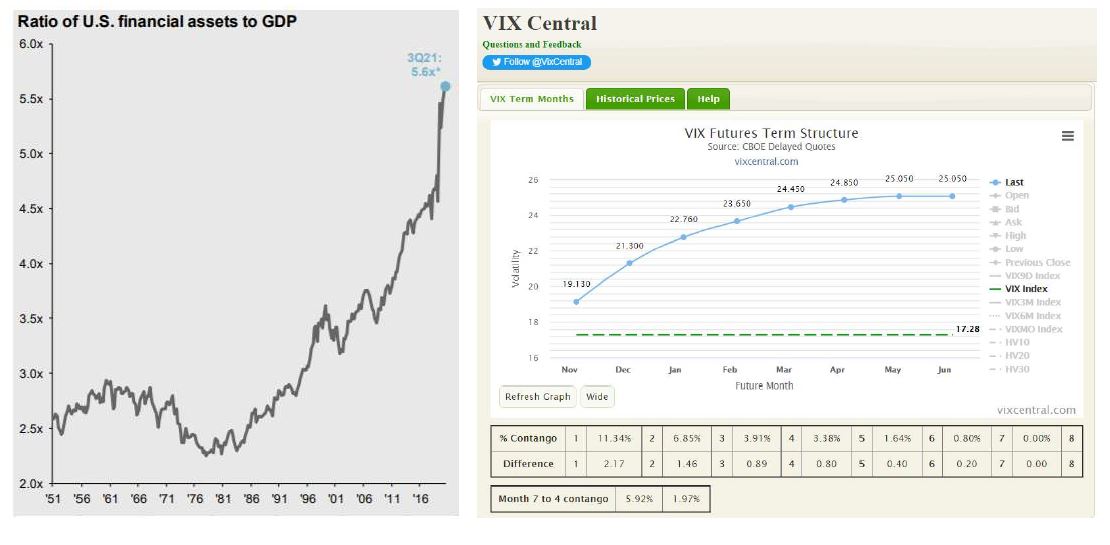
The old Wall Street saying, that the market could continue to “climb the wall of worry” in the midst of all this uncertainty and unease, is a very likely short-term outcome, potentially lead by non-Mega cap growth stocks climbing to even higher multiples. The chart on the left is a chart of US financial assets to GDP, showing the wealth effect of our collective echo chambers. The chart on the right shows the contango across almost the entire VIX curve, leading to the wall of worry scenario.
Fears of Inflation
Fears of inflation are one of the main reasons this wall of worry is a likely short-term outcome, and lack of realized fears of inflation is what could cause this Christmas growth rally to occur. The M2 Index shown on the right represents the total amount of money in circulation in the US. 35% of all dollars in circulation were printed since the pandemic. Google Trends search for “inflation” is potentially spiking again.
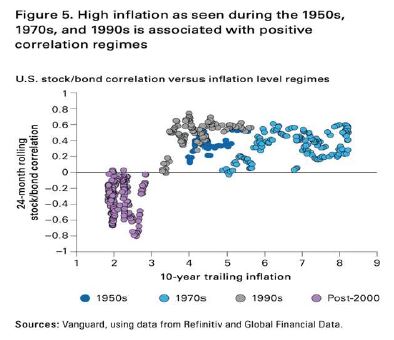
Inflation is potentially terrible for any form of traditional efficient frontier portfolio, damaging to both traditional broad stock and bond market indexes. Historically, any spouts of inflation can lead to increased correlations between stocks and bonds. This is not to say we don’t fear inflation – just that realization of inflation is not likely to mirror what happened in the past. Even if we avoid 1970’s level inflation, it can be damaging to the all-important stock/bond correlation.
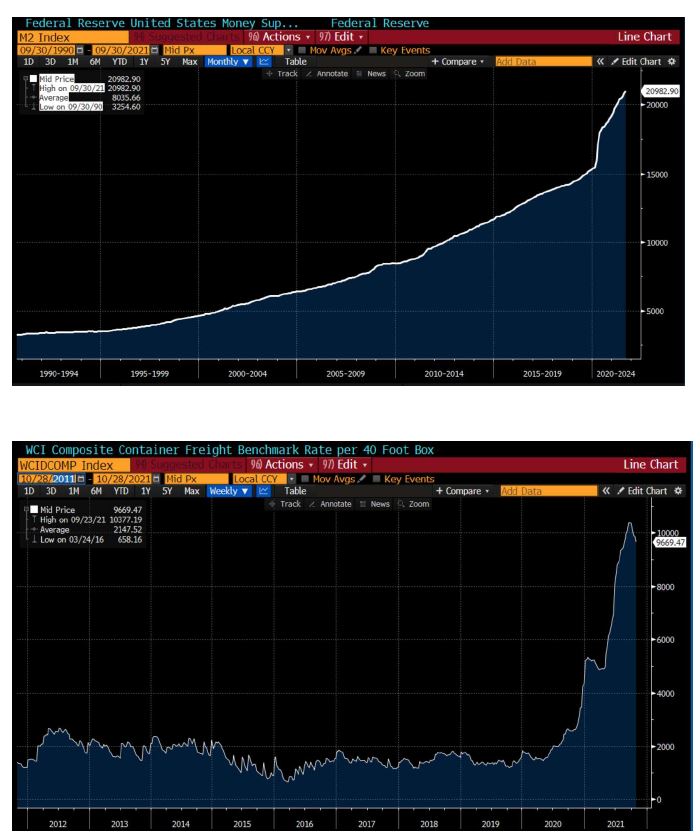
Yes, this potential inflation is due to the Federal Reserve, but also supply bottlenecks in an economy that spent decades globalizing and maximizing efficiency, and padding margins by way of trimming the fat. This often was that same insurance in case of business disruption by way of personnel, excess storage of whatever your business needed on hand, and diversified distribution channels. Shipping containers are lined up for miles off the coast of California, leaving our increased dependence on e-commerce unable to actually deliver finished goods, and semi-conductor chip shortages dragging launches of new and improved ones.
 To give some insight to geopolitical tensions involving semiconductors; Taiwan Semiconductor finds itself dead smack in the middle of political tensions between the US, China & Taiwan, as both powerhouse countries push for expansion of chip factories on their home territory. The current expectation is both the US and China will get Taiwan Semiconductor factories and will both produce chips a generation behind it’s primary factorys in Taiwan. Economic power protected by military force now has to contend with more delicate shifts of power such as who gets to produce the best chips, vaccinees, and mine rare metals beyond traditional commodity needs such as oil and natural gas.
From a political standpoint, it appears the current potentially short term separation of Donald trump and republicans, as well as the lack of a true ending to covid has taken some steam away from Democrats. This impacts the likelihood of as significant changes in tax codes as once expected.
Economic data continues to be strong. Supply issues could unwind, which down the road could lead to actual deflation through inventory build up. For now that is not the case. We continue to expect this hybrid semi-opened covid economy will persist for quite some time.
US Equities
Have we reached peak earnings? GDP and Revenue exploded post pandemic. Regardless of buyers’ appetite and ability to spend, it’s hard to see how supply disruptions won’t ultimately hit the bottom lines. Annualized earnings on the S&P 500 Index have hit $210. Growth stocks, after finally falling from grace in the face of inflation fears post-pandemic, have actually had fantastic economic results. However, growth stocks have significantly underperformed, with worrisome future guidance expectations and the effects of dependence on growth when interest rates climb.
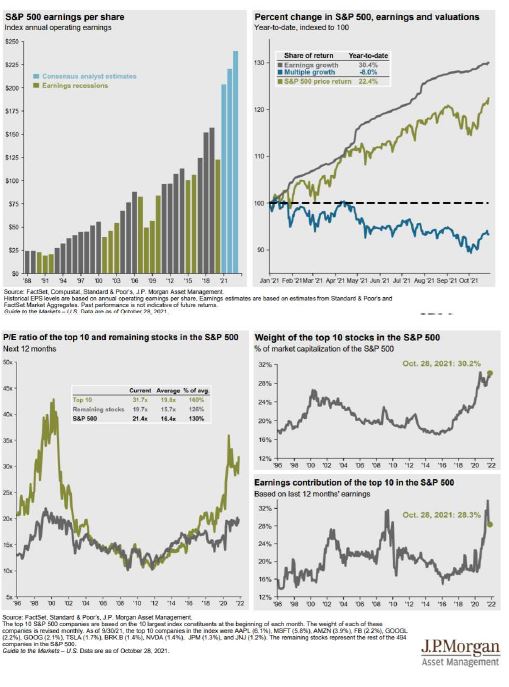 US equity markets dependence on our mega-caps (think Microsoft, Apple, Amazon, Meta, Alphabet, Tesla and Nvidia) is higher than ever. The top 10 holdings in the S&P now make up 30.2% of the index, and 28.3% of its earnings. They garner a P/E of 31.7x, while the remaining 490 stocks are priced at 19.7x. Microsoft, Apple, Amazon, Meta, Alphabet, Tesla and Nvidia are also the 7 largest companies in the world, followed by the largest semi-conductor company, Taiwan Semiconductor Manufacturing Co. While old school FAANG may not be classified as technology as a whole, the IoT (Internet of Things) economy dominates global economies, regardless of categorization.
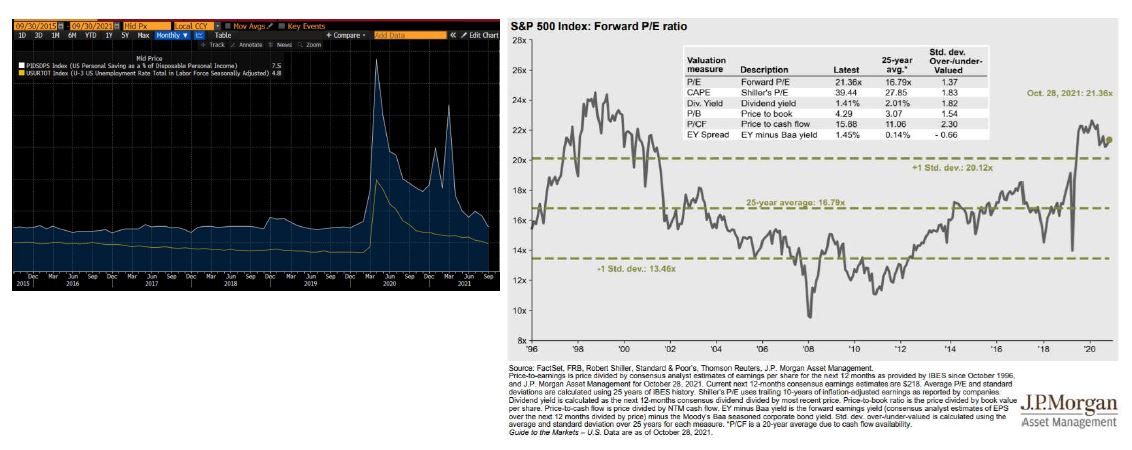
The iShares S&P 500 ETF (IVV) finished October up 24% for the year, 0.6% for Q3 and 7% for October. The iShares S&P 500 Growth ETF (IVW) and iShares S&P 500 Value ETF (IVE) returned 26.8% & 20.%4 for the year, 9% & 4.6% for October with growth taking the lead once again. Overall market participants are in a healthy place. Savings rates, while lower, still have a bit of cushion, and unemployment is low. Stocks, on a forward P/E, are high on historical levels, but could absolutely get higher. Margins could erode due to all of the supply shocks, and therein lies the yin and yang of investing in today’s markets. We continue to add active share to portfolios, moving further and further away from traditional market cap indexes at this point.
International Developed Equities & Emerging Markets
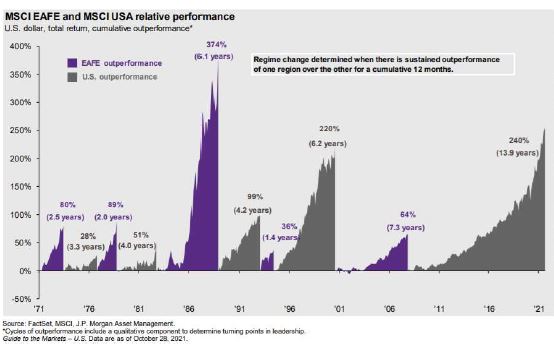 MSCI ACWI ex US, measured by the iShares MSCI ACWI ex US ETF (ACWX), was up 8.2% through October. iShares MSCI EAFE ETF (EFA) was up 11.2%, while the iShares MSCI EM ETF (EEM) is down -1.3 % for the year. International developed equities are the value play of all value plays, or a perpetual value trap lead by an unhealthy banking system hooked on the ECB. They continue to be further behind the US in its vaccination rollout. The story in emerging markets is China.
China’s “common prosperity” is an attempt to mix capitalism with socialism. Everything from defaulting real estate markets to increased bond yields, beaten down tech giants, and fears of US inflation spreading to the emerging markets as it historically does have left selective opportunities for significant returns in the future (all-beit, still dependent on the Federal Reserve engine described above).

Fixed Income
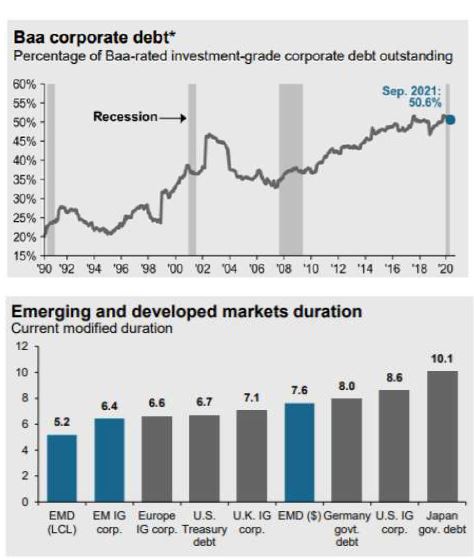 Issues with market cap indexes is most often discussed in equity markets. We ourselves dedicated a whole section to show you the concentration our mega-caps have in both the S&P 500 & MSCI World Index. Even with that said, the potential future death of traditional market cap weighted benchmarks may be caused by fixed income indexes. The very issuance of more debt increases a company’s allocation in a bond index, autogenerating buys in products that track these indexes. It’s always nice knowing you can automatically create at least some demand whenever you need more debt. But these indexes have changed over time. Baa corporate debt, a rating just one category above high-yield, now makes up 50.6% of the outstanding corporate bond market. Duration of this debt has risen to 8.7 years, making these indexes and products that track them exposed to a greater magnitude of movement if interest rates move.
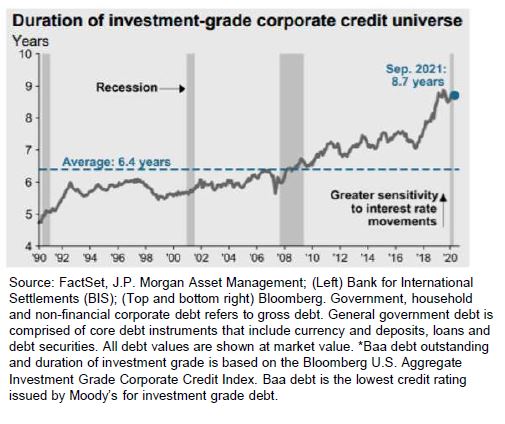
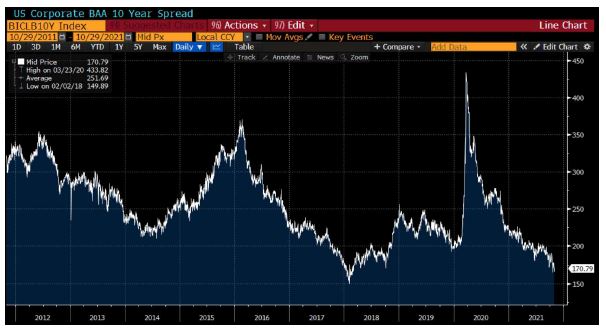
A cascading downgrade of debt would be disastrous to the fixed income market, all while credit spreads (below) are near all-time lows. High active share and bar-belling risks are the best bet for Fixed Income markets.
Alternatives
Invesco DB Commodity Index Tracking ETF (DBC) is up 45.7% YTD but has slowed down as of late relative to broader equities. Gold continues to disappoint down -6.8% for the year. The bitcoin futures strategy fund launched, taking in record breaking assets in its first few days.
A hypothetical high-active-share reconstruction of a traditional 60/40:
• 5% PIMCO 25+ Year Zero Coupon US Treasury Index ETF (ZROZ)
• 5% PIMCO 25+ Year Zero Coupon US Treasury Index ETF (ZROZ)
• 7.5% Saba Closed-End Funds ETF (CEFS)
• 5% AGFiQ US Market Neutral Anti-Beta (BTAL)
• 2.5% Simplify Interest Rate Hedge ETF (PFIX)
• 2.5% FolioBeyond Rising Rates ETF (RISR)
• 10 % SPDR Gold MiniShares Trust (GLDM)
• 7.5% Amplify Transformational Data Sharing ETF (BLOK)
• 7.5% Sofi Gig Economy ETF (GIGE)
• 7.5% SPDR S&P Kensho New Economies Comps (KOMP)
• 7.5% Davis Select Worldwide ETF (DWLD)
• 7.5% Emerging Markets Internet & Ecommerce (EMQQ)
• 7.5% Ballast Small / Mid Cap ETF (MGMT)
• 7.5% Direxion Moonshot Innovators ETF (MOON)
• 5% First Trust Industrial Renaissance (AIRR)
• 5% Invesco Dynamic Leisure & Entertainment ETF (PEJ)
• 5% Distillate US Fundamental Stability & Value ETF (DSTL)
Conclusion: What to Watch For
- The decoupling of equities as we begin to localize markets and supply chains, and the decoupling of the internet of things stocks, both internationally and within the US.
- The decoupling of equities as we begin to localize markets and supply chains, and the decoupling of the internet of things stocks, both internationally and within the US.
- Margins Margins Margins; Inflation, Shipping costs and semi-conductor chips, can the margins explosion continue?
- Credit Spreads & Default Rates – a matter of when, not if – but this could be kicked down the road many times before it ultimately causes a real market disruption.
- How much longer will this year’s record flows into equities continue? (See last commentary).
Disclaimer: This commentary is distributed for informational and educational purposes only and is not intended to constitute legal, tax, accounting or investment advice. Nothing in this commentary constitutes an offer to sell or a solicitation of an offer to buy any security or service and any securities discussed are presented for illustration purposes only. It should not be assumed that any securities discussed herein were or will prove to be profitable, or that investment recommendations made by Toroso Investments, LLC will be profitable or will equal the investment performance of any securities discussed. Furthermore, investments or strategies discussed may not be suitable for all investors and nothing herein should be considered a recommendation to purchase or sell any particular security.
Investors should make their own investment decisions based on their specific investment objectives and financial circumstances and are encouraged to seek professional advice before making any decisions. While Toroso Investments, LLC has gathered the information presented from sources that it believes to be reliable, Toroso cannot guarantee the accuracy or completeness of the information presented and the information presented should not be relied upon as such. Any opinions expressed in this commentary are Toroso’s current opinions and do not reflect the opinions of any affiliates. Furthermore, all opinions are current only as of the time made and are subject to change without notice. Toroso does not have any obligation to provide revised opinions in the event of changed circumstances. All investment strategies and investments involve risk of loss and nothing within this commentary should be construed as a guarantee of any specific outcome or profit. Securities discussed in this commentary and the accompanying charts, if any, were selected for presentation because they serve as relevant examples of the respective points being made throughout the commentary. Some, but not all, of the securities presented are currently or were previously held in advisory client accounts of Toroso and the securities presented do not represent all of the securities previously or currently purchased, sold or recommended to Toroso’s advisory clients. Upon request, Toroso will furnish a list of all recommendations made by Toroso within the immediately preceding period of one year.
