
In this article, I focus on the Treasury yield curve, which is sending its sharpest warning about recession risks since 1981.
The Fed and Yields
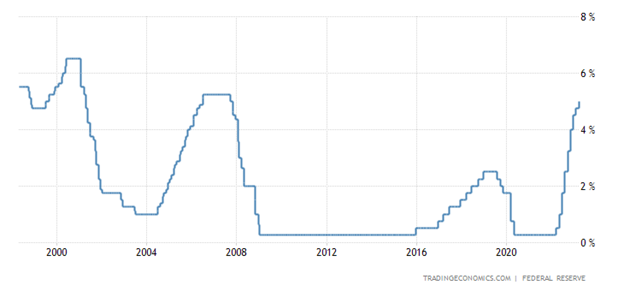
The Fed took decisive action to combat runaway inflation. The upper bound of the Fed Funds rate was raised from 0.25% to 5% in nine rate hikes, pushing borrowing costs to the highest since 2007.
Fed Funds Rate, 25 Years
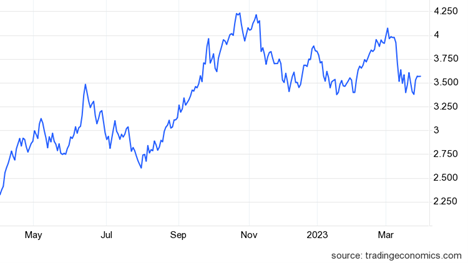
Longer-term yields, which are set via market trading in Treasury notes, also rose but lagged the upward pace of short-term yields. The benchmark 10-year yield fluctuated above 3.4%, currently 3.6%:
10-Year Treasury Yield, 1 Year
The Yield Curve
Thus, the 10-year yield is now trading significantly below short-term yields (3-month at 4.88%). Normally, yields for long-term bonds stay above short-term (a “normal” curve) most of the time as their higher risk, in theory, requires higher return. Long-term yields trading below short-term is called an “inverted curve.”
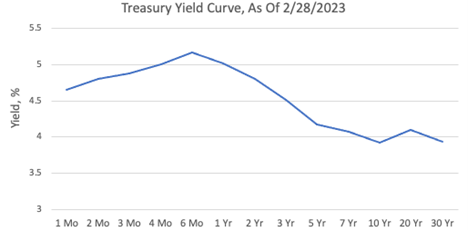
Source: US Treasury
The difference, or spread, between the 10-year and 3-month yields (the blue line on the chart), and the 10y-2y spread (the purple line), both have reached around -1% – the largest inversion since 1981. It only reached lower levels twice, in 1980 and 1981 (because the absolute level of Treasury yields was much higher then).
Yield Curve Spread, 1962-2023
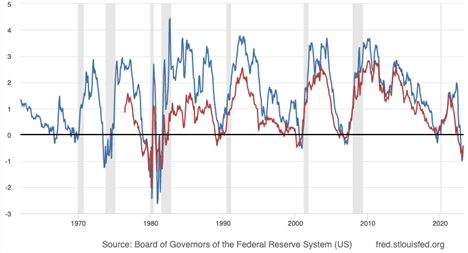
An inverted yield curve preceded all eight U.S. recessions since the beginning of market trading in Treasury securities. The lead time between the inversion and the beginning of a recession ranges from immediate (in the 1970s and 80s) to nine months (the 2008-09 recession). A false signal was given in 1966, when a recession didn’t occur after a 3m inversion, and in 1998 when a very small, 0.05% 2y inversion occurred for a brief month. Before the 1990 recession, only the 2y inversion occurred but technically, not the 3m (although it was very close).
The magnitude of the inversion doesn’t seem to matter, as long as at least one significant (larger than 0.05%) inversion lasts for longer than a month. For example, inversion reached 38 basis points on 3/31/2007 as the mortgage crisis was unfolding and before the 2007-09 recession and bear market. It reached 53 bps on 12/31/2000, before the 2001-02 bear market and recession.
A 3m inversion occurred even in mid-2019 and preceded the 2020 bear market and recession, even though that downturn was arguably caused by an exogenous event – the COVID-19 pandemic. However, the economy was weakening in late-2019, and it’s unclear if a recession would have followed anyway.
This brief review confirms that the yield curve inversion is historically a very reliable indicator of an upcoming recession.
The Way Forward
The yield curve can normalize if short-term yields (which follow closely the Funds rate set by the Fed) fall below long-term. It typically occurs as part of an economic contraction, falling demand, and a collapse in prices (deflation). By that time, the Fed might be forced to lower the Funds rate.
Considering the Fed’s current focus on combatting inflation, short-term rates/yields can only decline when the Fed wins the fight against inflation. This will happen when demand falls so much as to cause a drop in consumer inflation (currently still high at 6%).
The Fed is fully aware, and in fact expects, that it might take a recession to win against inflation. Fed chairman Powell openly warned in his Jackson Hole speech in November-2022 that “hard times for families and businesses” (the “Fed speak” for a recession) are likely to result from its tightening policy. His hawkish public remarks support this view.
While the yield curve is not the only predictive indicator, its long-term track record is compelling. The large yield curve inversion signals that a recession is very likely, probably as soon as this year. A recession will be very negative for the stock market as the economy’s forward-looking barometer.
About Model Capital Management LLC
Model Capital Management LLC (“MCM”) is an independent SEC-registered investment adviser, and is based in Waltham, Massachusetts. Utilizing its fundamental, forward-looking approach to asset allocation, MCM provides asset management services aimed to help other advisors implement its dynamic investment strategies designed to reduce significant downside risk. MCM is available to advisors on SMArtX Advisory, Axos Advisor Services, and Envestnet platforms, but is not affiliated with those firms.
Notices and Disclosures
- This research document and all of the information contained in it (“MCM Research”) is the property of MCM. The Information set out in this communication is subject to copyright and may not be reproduced or disseminated, in whole or in part, without the express written permission of MCM. The trademarks and service marks contained in this document are the property of their respective owners. Third-party data providers make no warranties or representations relating to the accuracy, completeness, or timeliness of the data they provide and shall not have liability for any damages relating to such data.
- MCM does not provide individually tailored investment advice. MCM Research has been prepared without regard to the circumstances and objectives of those who receive it. MCM recommends that investors independently evaluate particular investments and strategies and encourages investors to seek the advice of an investment adviser. The appropriateness of an investment or strategy will depend on an investor’s circumstances and objectives. The securities, instruments, or strategies discussed in MCM Research may not be suitable for all investors, and certain investors may not be eligible to purchase or participate in some or all of them. The value of and income from your investments may vary because of changes in securities/instruments prices, market indexes, or other factors. Past performance is not a guarantee of future performance, and not necessarily a guide to future performance. Estimates of future performance are based on assumptions that may not be realized.
- MCM Research is not an offer to buy or sell or the solicitation of an offer to buy or sell any security/instrument or to participate in any particular trading strategy. MCM does not analyze, follow, research or recommend individual companies or their securities. Employees of MCM may have investments in securities/instruments or derivatives of securities/instruments based on broad market indices included in MCM Research. MCM’s Form ADV, Part 2A (Brochure) contains further details pertaining to employee training.
- MCM is not acting as a municipal advisor and the opinions or views contained in MCM Research are not intended to be, and do not constitute, advice within the meaning of Section 975 of the Dodd-Frank Wall Street Reform and Consumer Protection Act.
- MCM Research is based on public information. MCM makes every effort to use reliable, comprehensive information, but we make no representation that it is accurate or complete. Opinions or information are subject to change with respect to MCM Research.
- MCM DOES NOT MAKE ANY EXPRESS OR IMPLIED WARRANTIES OR REPRESENTATIONS WITH RESPECT TO THIS MCM RESEARCH (OR THE RESULTS TO BE OBTAINED BY THE USE THEREOF), AND TO THE MAXIMUM EXTENT PERMITTED BY LAW, MCM HEREBY EXPRESSLY DISCLAIMS ALL WARRANTIES (INCLUDING, WITHOUT LIMITATION, ANY IMPLIED WARRANTIES OF ORIGINALITY, ACCURACY, TIMELINESS, NON-INFRINGEMENT, COMPLETENESS, MERCHANTABILITY AND/OR FITNESS FOR A PARTICULAR PURPOSE).
- “Model Return Forecast” for 6-month S&P 500 return is MCM’s measure of attractiveness of the U.S. equity market obtained by applying MCM’s proprietary statistical algorithm and historical data, but is not promissory, and, by itself, does not constitute an investment recommendation. Model Return Forecasts were calculated and applied by MCM to its research and investment process in real time beginning from 2012. For periods prior to Jan 2012, the results are “back-tested,” i.e., obtained by retroactively applying MCM’s algorithm and historical data available in Jan 2012 or thereafter. Back-tested performance, if any, is presented gross of any advisory fees and trading expenses. Index returns referenced in MCM Research, if any, are gross of any advisory fees, fund management fees, and trading expenses. Fund or ETF returns referenced, if any, are gross of advisory fees and trading expenses. Returns will be reduced by fees and expenses incurred.
For more news, information, and analysis, visit the ETF Strategist Channel.
