
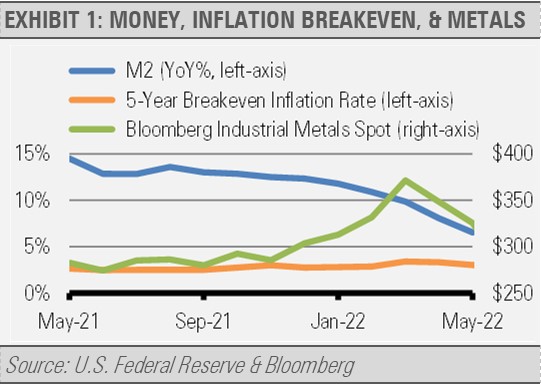
Our work suggests that the recession currently priced into the equity market has yet to show up. In fact, there are some positive signs that this economy will not go down without a fight. For example, we are seeing early signs that inflationary pressures are easing. This does not mean an immediate reduction in inflation, but we do think that pricing pressures will trend closer to their long-term average over the next couple of years. For example, economic growth in the U.S., while not in a recession, has slowed to below its 2% long-term potential growth rate. An economy operating above its long-term potential, as the U.S. had been until recently, increases inflationary pressure. With commodity prices rolling over, the growth rate of broad money (M2) declining, and market-based inflation expectations falling back, it looks like the U.S. Federal Reserve (Fed) does not have to move much more than it already has for inflationary pressures to ease (exhibit 1). We estimate that inflation should fall back to long-term trends over the next two years. As a result, we also think that the biggest upward moves in long-term interest rates, including mortgage rates, may be behind us.
Meanwhile, household balance sheets are in good shape overall. For example, household debt to GDP, which is a measure of indebtedness relative to the size of the overall economy, is twenty percentage points lower than it was at the peak of the housing boom (exhibit 2). Importantly, households are in a much stronger financial position than prior to the Global Financial Crisis (GFC).

As the core of the U.S. economy, the strength of household balance sheets makes our economy more resilient to shocks.
Looking at home construction specifically, we can compare construction trends to household formation over time to see if the housing industry has been overbuilding and due for a decline, or if there is sufficient demand for more growth ahead. For example, during the period of 1996-2006, our analysis suggests that the housing industry overbuilt by constructing 3.9 million more new homes relative to the rate of new household formation.
After the collapse of the housing boom going into the GFC, the housing industry built far fewer homes than would be sufficient to meet demand from annual new household formation. For example, from 2007-2019, the industry built 4.9 million fewer new homes than would be necessary to meet demand from new household formation. As a result, housing construction is really only getting back to normal rates and is not likely at risk of collapsing given the overall strength of household balance sheets (exhibit 3).

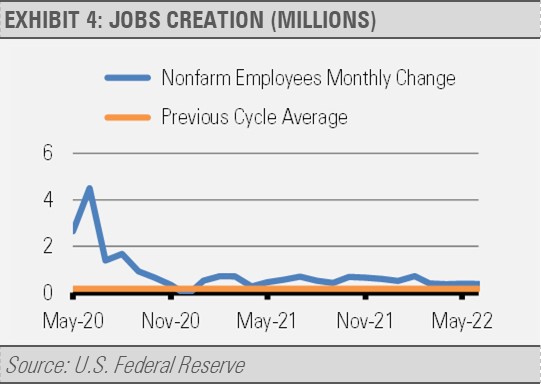
While U.S. economic growth has slowed, recent data, such as employment reports and business surveys, suggests that the economy has not tipped into a recession. For example, the June employment report showed an additional 372,000 U.S. jobs created. In fact, the economy has added more than 2.7 million jobs during the first half of this year. Since the current business cycle began in May 2020, monthly jobs creation has been far greater than the 167,938 jobs created on average per month during the previous business cycle from July 2009 through February 2020.
In addition, we can look at the economically weighted composite of purchasing manager indices as one broad measure of economic activity. The latest reading of this measure, which is just below the average of the previous business cycle, shows a slow pace of growth.

Still, economic growth persists. In fact, the decline in first quarter 2022 GDP was primarily due to a jump in imports versus exports that we think has reversed. This reversal should provide a boost to overall growth. Even slow growth leads to higher corporate revenues and earnings over time.
INVESTMENT IMPLICATIONS
We are finding compelling investment opportunities while still managing risk in real time. To help manage geopolitical risks and market uncertainties, we are holding more cash than normal by reducing our foreign equity exposures. This cash can help smooth market volatility while also giving us dry powder to put to work as we find new opportunities. In addition, some of the investments that we have made tend to be significantly less volatile than the broad equity market. These investments include variable-rate preferreds, low volatility equities, and companies in the health care sector. Meanwhile, we are finding favorable investment opportunities in the U.S. financials sector as well as small cap value stocks. On the fixed income side, we have been adding to our core bond exposures and taxable municipal bonds to increase our high-quality yield at more attractive levels now that long-term interest rates have moved higher.
In conclusion, we think that the U.S. equity markets have priced in an extremely high probability of a recession. It is as if the U.S. equity market is planning a recession, but the economy is choosing not to participate. Instead, we think that we are experiencing a valuation compression based on higher interest rates.
Once the market realizes that recession risks may be premature, we expect our equity positions to do very well. In addition, rising rates may provide some long-awaited opportunities in fixed income markets. Our fixed income allocations are still underweight interest rate sensitivity, so they should continue to hold up better than the broad bond market if interest rates move higher. We have been able to buy high-quality fixed income assets at attractive yields that will help generate solid current income while still acting as that ballast from equity market risk that we look for in our investment grade holdings.
THE CASH INDICATOR
The Cash Indicator (CI) is useful for helping us judge potential volatility, which includes the current market stress. While still elevated relative to historic norms, the CI has fallen back significantly in recent weeks as market stresses have eased somewhat.
The environment is evolving, and we expect the volatility to normalize with time. These findings are also consistent with our fundamental work that indicates this is a market correction that is nearing its end and should not turn into a prolonged crisis.

DISCLOSURES
Any forecasts, figures, opinions or investment techniques and strategies explained are Stringer Asset Management, LLC’s as of the date of publication. They are considered to be accurate at the time of writing, but no warranty of accuracy is given and no liability in respect to error or omission is accepted. They are subject to change without reference or notification. The views contained herein are not be taken as an advice or a recommendation to buy or sell any investment and the material should not be relied upon as containing sufficient information to support an investment decision. It should be noted that the value of investments and the income from them may fluctuate in accordance with market conditions and taxation agreements and investors may not get back the full amount invested.
Past performance and yield may not be a reliable guide to future performance. Current performance may be higher or lower than the performance quoted.
The securities identified and described may not represent all of the securities purchased, sold or recommended for client accounts. The reader should not assume that an investment in the securities identified was or will be profitable.
Data is provided by various sources and prepared by Stringer Asset Management, LLC and has not been verified or audited by an independent accountant.
