ECONOMIC OVERVIEW
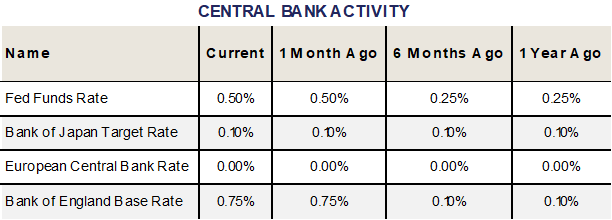
The Federal Open Market Committee will meet this week and likely announce a 50 basis point hike in the Fed Funds rate, taking the short-term marker from .50% to 1.00%. Market forecasters will be keenly monitoring the Fed’s subsequent dot-plot, as well as Chair Powell’s comments at the post-meeting debrief, for clues into the pace of future interest rate hikes.
With the March Consumer Price Index showing a +1.2% MoM rise and the Producer Price Index edging up a greater than expected +1.4% MoM, it’s clear the Fed has a long way to go before it catches up to today’s inflation readings. CPI is running at +8.5% on a YoY basis while PPI has surged +11.2%. The Fed’s favored measure the PCE Core Deflator is even up +5.2%, while the Fed Funds rate remains sub 1%.
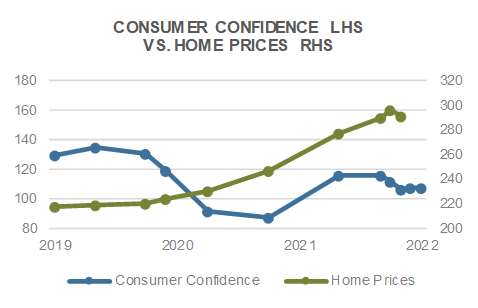
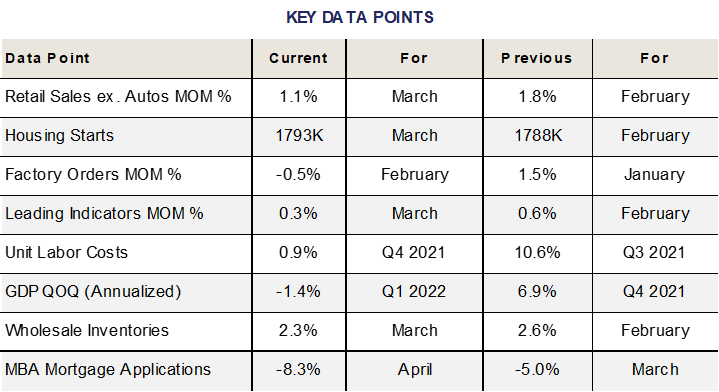
Despite the move higher in mortgage interest rates, the housing market remains hot. The S&P CoreLogic CS 20-City index surged +2.4% MoM in February and is now up +20.2% YoY. The fundamental mismatch between the current supply and current demand for housing suggests that prices may remain robust, even in the face of higher mortgage rates. Housing Starts rose +0.3% in March, while Existing Home Sales fell -2.7% and New Home Sales dropped -8.6%.
The first look at Q1 GDP came in lower than expected with the report showing the economy contracted -1.4% on an annualized basis (expectations were for growth of +1.0%). The consumer remained strong in March as Personal Income rose +0.5% while Personal Spending surged +1.1%, beating expectations for a +0.6% rise. The ISM Manufacturing reading for April came in below expectations at 55.4, although still suggestive of expansion.
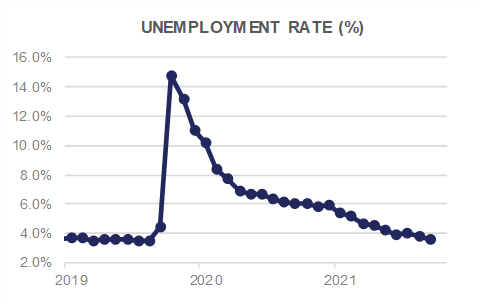
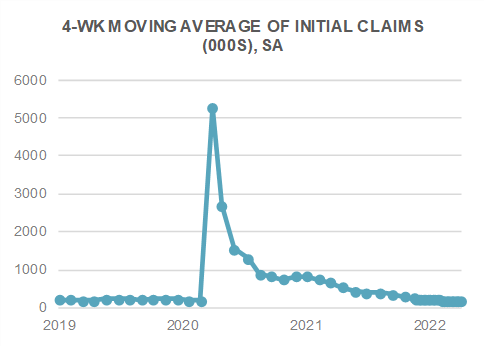
The labor market remains challenged as the Unemployment Rate for March came in at 3.6% while the latest JOLTS report showed more than 11 million jobs available. The Employment Cost Index is up +4.5% YoY as of the end of Q1, and upward pressure remains on wages as the world continues to grapple with Covid-related disruption.
The aforementioned Federal Reserve meeting this week should offer a glimpse into its thinking on inflation and the subsequent pace of interest rate hikes needed to quell rising prices. Markets are nervously anticipating various outcomes, including a 75 basis point hike this week. Further hawkishness will be required in order to convince investors the Fed truly grasps the pernicious nature of inflation. Having hidden behind the “transitory” thesis for too long, the Fed’s credibility with regard to inflation fighting is clearly on the line.
DOMESTIC EQUITY
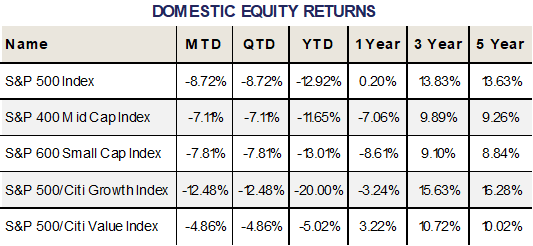
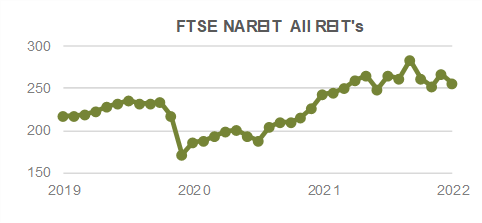
U.S equities suffered their worst month since March 2020 this past month, with the benchmark S&P 500 Index falling -8.72% during the period to close at 4,132. Mid- and Small-Caps, as measured by the S&P 400 and 600 Indices fared slightly better, losing -7.11% and -7.81%, respectively. The subtle outperformance versus Large-Caps can be primarily attributed to “FAANG” (Facebook, Apple, Amazon, Netflix, Google), or the lack thereof in the SMID-cap space. The FAANG cohort was responsible for 37% of the S&P 500’s April decline according to S&P Dow Jones Indices. Extrapolating further, Growth stocks, as measured by the S&P 500/Citi Growth Index lost -12.48% during the period, compared to a -4.86% loss for the S&P 500/Citi Value Index. For the year, Growth stocks are down a firm -20.00%, in line with the NASDAQ Composite Index, which is down fractionally more. Value stocks, on the other hand, have held their own, losing only -5.02% year to date, compared with -12.92% for the S&P 500 as a whole.
Last week marked one of the busiest weeks for corporate earnings so far this earnings season, headlined by reports from Google (Alphabet), Microsoft, Facebook (Meta), and Apple. Netflix reported earnings the week prior, after which its stock plummeted more than -30%. Amazon shed nearly -14% post its earnings release, and even Apple wasn’t immune despite beating both top and bottom line estimates. The market continues to digest a host of earnings releases amidst surging inflation, supply chain woes, China’s Zero COVID policy, and Federal Reserve monetary policy uncertainty. The Federal Open Market Committee is scheduled to deliver a widely anticipated 50bp rate hike on Wednesday, and all eyes will be glued towards Fed Chair Powell’s commentary on the pace of future rate hikes, balance sheet runoff, and the overall central tendency of the Fed’s “Dot Plot”. Adding to the uncertainty around the Fed, the US economy contracted -1.4% in Q1 on the heels of the Omicron variant surge back in January. Put bluntly, much uncertainty abounds; however, valuations continue to remain supportive.
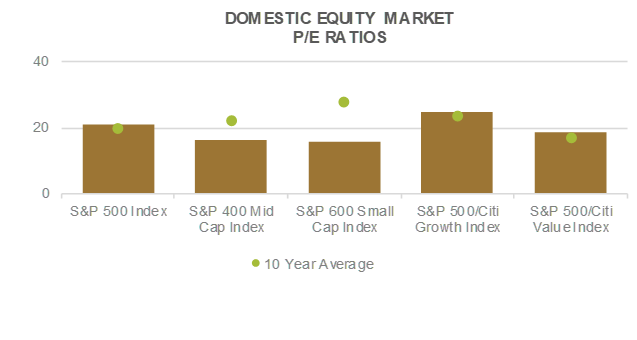
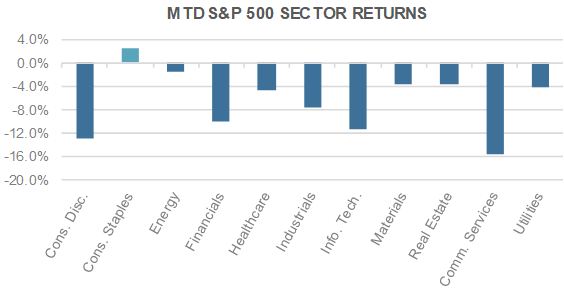
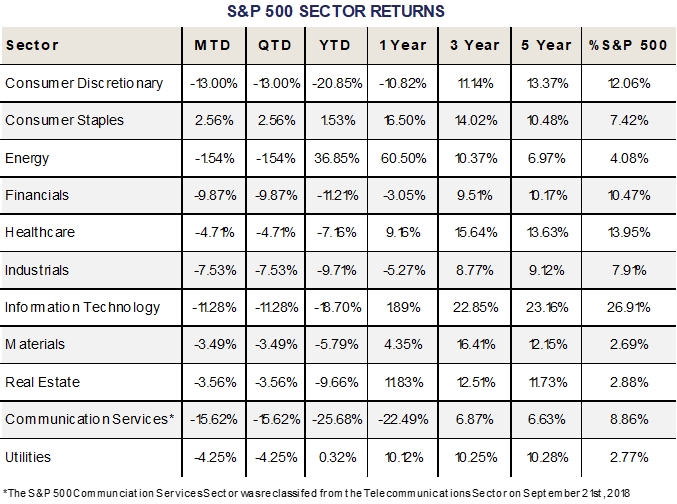
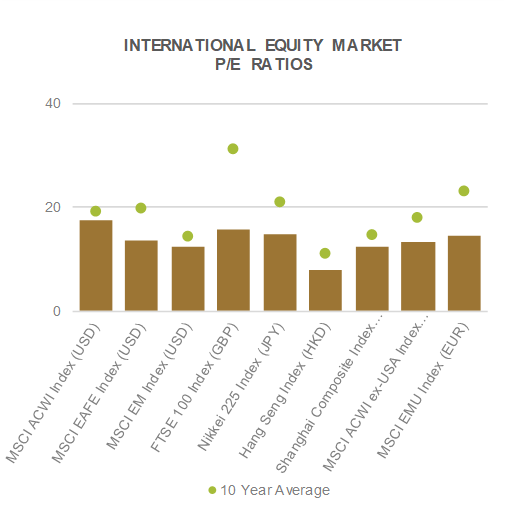
Earnings estimates for the S&P 500 continue to increase for FY 2022 ($228) and 2023 ($250), putting the S&P 500 at approximately 16.9x 2023 earnings estimates. Perhaps more importantly, Small-Cap earnings estimates for 2022 ($90) and 2023 ($103) also continue to rise, putting the S&P 600 Index at 12.2x 2023 earnings, essentially back to its March 2020 COVID lows. Given Small-caps exposure to Financials and Value oriented sectors, the group can viewed as strong barometer of both the U.S. economy (nearly 80% of sales) and of risk appetite.At the sector level, only Consumer Staples posted positive performance on the month, and remains the only sector in positive territory for the year outside of Energy, which has surged +36.85% on the back of higher oil prices.
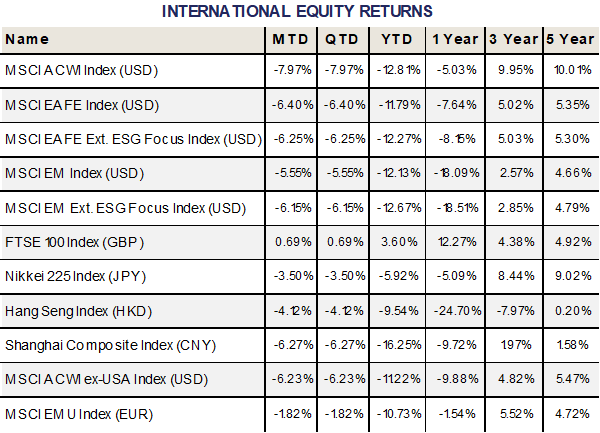
INTERNATIONAL EQUITY
International equities had a rough time in April, with both Developed Markets (DM) and Emerging Markets (EM) losing ground. DM equities, as measured by the MSCI EAFE Index lost -6.40% on the month, while EM equities fared slightly better, losing -5.55% during the period. Compared to the S&P 500’s -8.72% return, both DM and EM outperformed; however, all segments remain firmly in negative territory on the year, with DM down -11.79% and EM down -12.13%. Global equities as a whole, as measured by the MSCI ACWI Index are down -12.81% on the year; however, still sport a 5-year annualized return slightly greater than +10%.
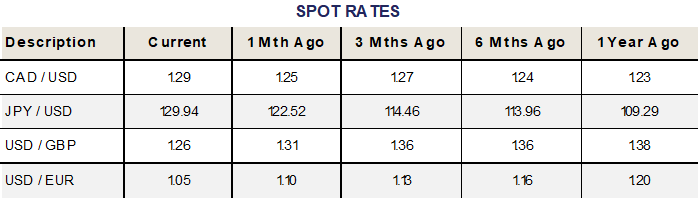
From a regional standpoint, Eurozone equities, as measured by the MSCI EMU Index lost -1.82% in EUR terms, and -6.54% in USD terms as the Euro fell to $1.05 from $1.10 the month prior. A slew of factors have negatively impacted the Euro versus the Dollar year to date including the war in Ukraine, interest rate differentials, and the overall direction of monetary policy. The Euro last tested the $1.05 level in December 2016. Expanding within Europe, UK equities, as measured by the FTSE 100 Index gained +0.69% in GBP terms, but lost -3.61% in USD terms as the Pound weakened to $1.26 from $1.31 the month prior.
At the individual country level, Canada lost -5.10% in CAD and -7.58% in USD term. Japanese equities lost -3.50% in JPY terms, and -10.43% in USD terms as the Yen weakened to 130 per Dollar from 122 the month prior. The Bank of Japan re-emphasized its commitment to yield curve control in April, pledging unlimited purchases of government bonds to hold rates down, creating massive divergence in policy compared to the Fed and other major global central banks. The knock on impacts have been felt in Korea and China, as other Asian currencies have weakened in sympathy, in addition to their own idiosyncratic reasons.
Pivoting to China, the Shanghai Composite Index lost -6.27% on the month in CNY terms, and -10.08% in USD terms. This compares to the MSCI China Index which returned -4.07% in USD terms. The primary differences in the indices boils down to sector exposure, with the latter heavily tilted towards Technology and Internet related equities. China’s Politiburo pledged to work on policy more favorable to Internet companies after the recent rout and spate of uncertainty, while the Peoples Bank of China (PBOC) cut reserve ratio requirements for banks by 1% to help stem the decline in the Yuan. With absolute levels of rates nearly on par with US rates, and an increasingly weaker Chinese economy, the Yuan remains a key barometer of risk moving forward given President Xi’s Zero COVID policy. Last check, CNY/USD traded at 6.60, weakening by more than 4% on the month. Stay tuned.
FIXED INCOME
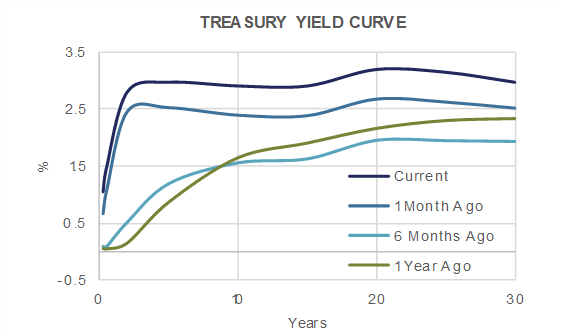
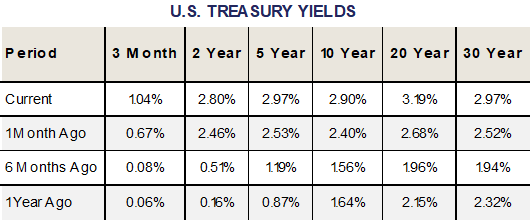
In the month of April, Treasury yields moved higher across the curve, most significantly amongst longer maturities. Year to date, the move higher in rates has been most significant in the 2 to 3 year maturity area. This was spurred by the rapid re-evaluation of the number of Federal Reserve rate hikes that are expected to be implemented as Chairperson Powell pivots to fight inflation. At the Federal Reserve meeting that ends this Wednesday, we expect to see the Fed raise rates by 50 basis points and to discuss shrinking their balance sheet by not reinvesting maturities/selling bonds that they purchased during Quantitative Easing (QE). It is possible for the Fed to emphasize their aggressiveness by raising rates or shrinking the balance sheet by more than market expectations, but that would likely lead to increased volatility which they typically prefer to avoid.
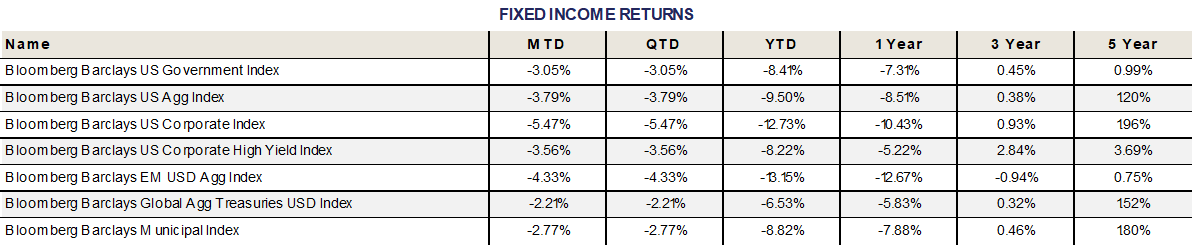
As interest rates rose in the month of April, most bond indices produced negative returns. Treasury bonds provided were the least negatively affected, as they were spared from the additional pain of spread widening.
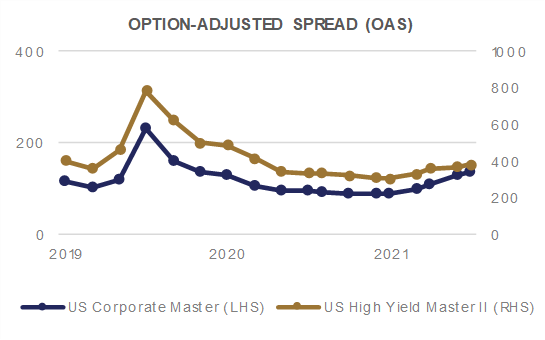
Credit spreads drifted slightly wider in the month of April. Single A corporate bonds and High Yield spreads remain inside of the wides experienced in mid-March, while BBB rated corporate bonds have breached the mid-March levels and are now at their widest level of 2022. This widening has put renewed pressure on corporate bond returns, as spread widening acts negatively on bond prices in the same way that higher interest rates do, by forcing the price of the bond to adjust lower. This has made investment grade corporate bonds the worst performer in April, and year to date.
Municipal bonds were one of the best performers in April, and are roughly in line with the rest of the market year to date. Relative to Treasury bonds, municipals appear to offer significant value. Historically, munis do not remain this attractive on a relative basis for significant periods of time.
On April 1st, we saw the 2 year Treasury yield exceed the 10 year Treasury yield. While it did not last long, it was an inversion of the yield curve, which typically precedes a recession by 12-18 months. It is certainly not a sure thing, but given the inversion, an aggressive Fed, geopolitical tensions, rising economic uncertainty, and high inflation among other concerns, it is a prospect that we must consider in our decision making process.
ALTERNATIVE INVESTMENTS
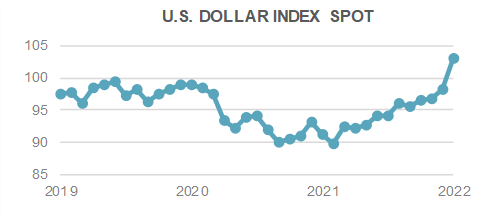
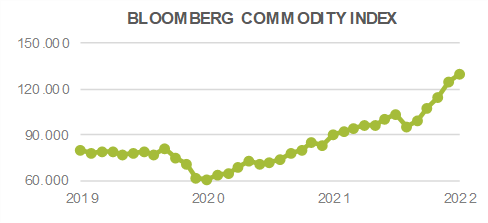
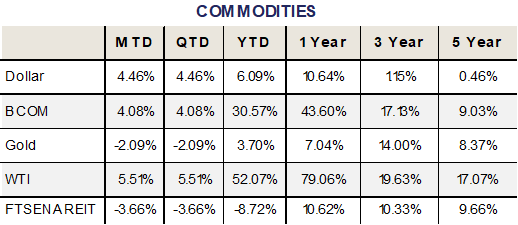
Alternative investments were mainly positive for the month of April. Broad Commodities, as measured by the Bloomberg Commodity Index, were up +4.08% for the month despite a stronger US Dollar. There is generally an inverse relationship between the price of commodities and the Dollar over time.
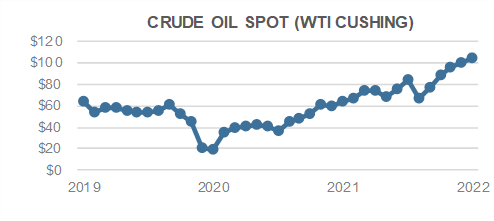
In a continuation of a trend seen throughout the year, many commodities and specifically energy prices were positive for the month while other risk assets were broadly negative. WTI Crude Oil was up +5.51% for the month, closing the month at a price of $104.69 per barrel. Oil is up over +50% for the year as supply/demand remains imbalanced and effects from the Russian invasion of Ukraine ripple through the global economy.
EU countries are accelerating their efforts to replace Russian oil and gas after Russia started demanding payments in rubles. After originally avoiding using sanctions on Russian energy, the EU is now considering a full on oil embargo after Russia cut off the gas supply to Poland and Bulgaria after they declined to pay in the Russian currency.
Although the fall of Russian oil production remains one of the main factors pushing energy prices higher, some counteracting bearish factors exist such as lower demand from China as the country continues to implement strict lockdowns.
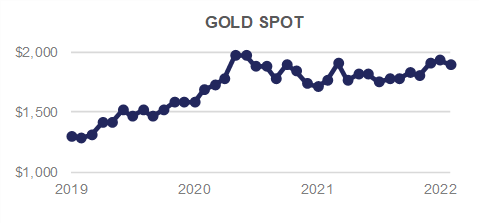
Gold finished the month down -2.09% but remains positive YTD, up +3.70%. Although the precious metal usually struggles to keep up in equity bull markets, it remains a useful portfolio diversifier and potential hedge during volatile markets. Demand for the asset has been strong this year as inflation remains elevated and 1970’s style stagflation remains a possibility (although not our base case).
Hedge fund strategies had mixed results during the month, with three out of nine strategies tracked posting positive returns on average. Macro strategies were the top performer for the month, up +1.90%, and remain the top performer for the year. Convertible Arbitrage strategies were the worst performer for the month as well as YTD.
ESG
ESG integrated indices continue to produce mixed results as carbon intensive exposures produce outsized returns due to inflationary pressures. This month Russia took the step of turning off the natural gas flowing in to Poland and Bulgaria to punish them for refusing to pay for their gas imports in Russian Rubles.
Fatih Birol, the executive director of the Paris-based International Energy Agency, said the cutoff was a “weaponization of energy supplies.” Ursula von der Leyen, the EU Commission President described it as, “yet another attempt by Russia to use gas as an instrument of blackmail.”
This was the most aggressive use of energy as a weapon thus far. Putin has threatened to cut off the supply to other countries as well, alongside military threats for providing support to Ukraine.
So far, these issues do not seem to have completely derailed the path to greater global sustainability. They present a challenge, clearly. We have moved away from the kumbaya feeling that we are all friends and will work together for each other’s benefit. It makes the transition more difficult, but does not reduce the need to move forward in a more sustainable manner.
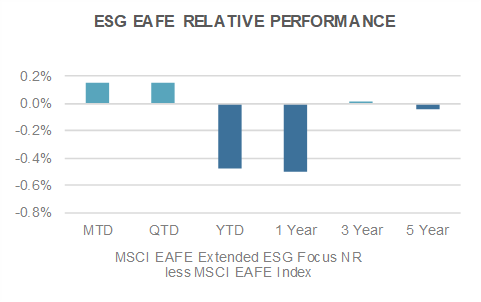
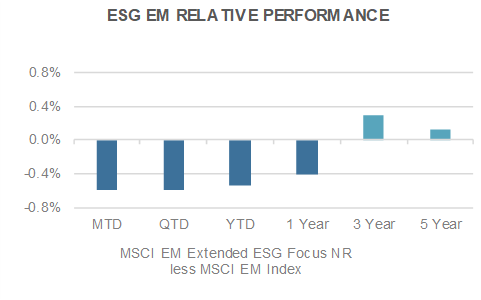
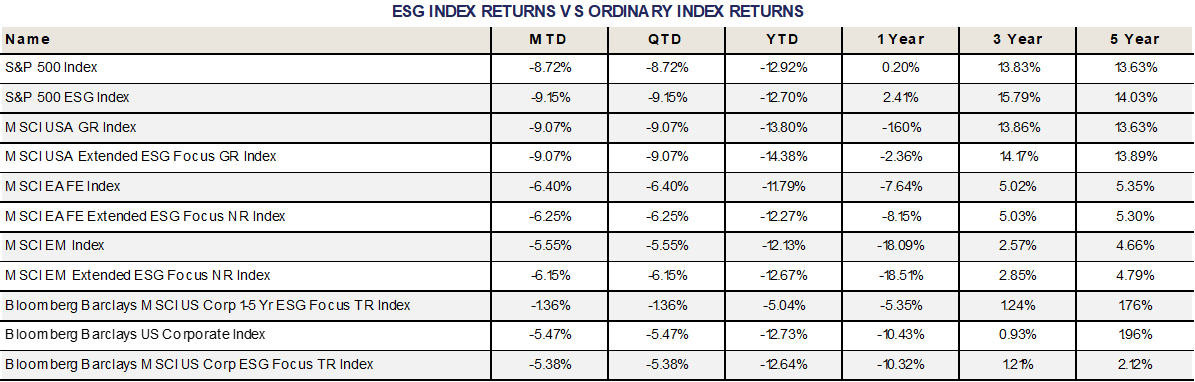
2022 returns for the ESG equity indices continue to be choppy. In April, the ESG integrated U.S. and Emerging Markets indices trailed their respective benchmarks, while the EAFE ESG integrated index outperformed its benchmark. ESG integrated Fixed Income also outperformed its non-ESG integrated counterpart.
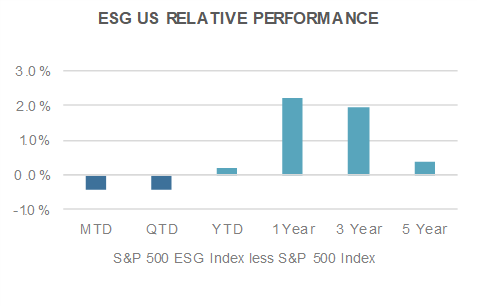
The ESG aligned U.S. index underperformed its non-ESG counterpart by 43 basis points in the month. Year to date it has outperformed by 22 basis points. One, three, and five year time periods remain additive to performance compared to the non-ESG aligned benchmark.
ESG integrated EAFE returns experienced 15 basis points of outperformance in April. Year to date, the performance of ESG integrated EAFE trailed its benchmark by 48 basis points. One year and five year periods trail non-ESG slightly, with the three year number continuing to show marginal outperformance.
Emerging Markets ESG equity performance lagged its benchmark by 60 basis points in April, reverting from its strong track record of being accretive to performance. The year to date number is better, with only 54 basis points of underperformance. Longer time horizons remain supportive of ESG integration into Emerging Markets portfolios.
ESG integrated Investment Grade corporate bonds outperformed their non-ESG equivalent by 9 basis points in April. Year to date ESG integrated IG bonds are again 9 basis points ahead of their benchmark. All time periods remain supportive of ESG integration into fixed income portfolios as this index has most consistently produced positive returns over its benchmark.
For more news, information, and strategy, visit the ETF Strategist Channel.