
Ryan Lehman, CFA, CAIA
“What has fundamentally changed is inflation. Once you bring in an inflation rate of 8.5%, suddenly the ability of the market to hold the Fed hostage dissipates. And that’s what I think the market is starting to realize. This is not the old days. Inflation has fundamentally changed the equation.” -Mohamed El-Erian
This year has been an unprecedented time for investors, as 40-year highs in inflation and fears over a looming recession have led to record losses in fixed income and bear market declines for most equity markets. However, there are still some investors holding out hope that a “pivot” can effectively reverse the upward trend in bond yields and reinvigorate stocks. Pivot refers to a reversal in the Fed’s current path of restrictive policy to something more accommodative…or at least neutral. But how did we get to a point where investors are already thinking about a change in policy, when the Fed just embarked on its rate hiking campaign in March? To better understand, let’s begin with a quick recap of the market and economy in 2022.
We’ll start with the elephant in the room…inflation. As of its most recent reading, year-over-year headline CPI came in at +8.3% (August 2022). This was a decline from what is expected to be peak inflation of 9.1%, one of the highest CPI readings in 40 years. To put this into historical perspective, statistically, inflation at this level or higher has only been observed 11% of the time. While there isn’t a root cause of this unprecedented spike in prices, there are a multitude of contributing factors on both the demand and supply sides of the economic equation. We have pressure coming from constrained supply chains due to the lingering impacts of the COVID-19 pandemic, demand pressure due to a combination of COVID-era fiscal stimulus and positive wealth effects from a rising stock market (prior to 2022), as well as the unforeseen pressures on energy and agricultural prices caused by Russia’s invasion of Ukraine.
These inflationary pressures have caused the Fed to engage in an aggressive interest rate hiking campaign, the likes of which many investors have never experienced. In the last six months alone (starting at their March 16th meeting) the Federal Reserve has raised the Fed Funds target range from 0-0.25% to 3.00%-3.25%, with the last three hikes coming in 75 bps chunks. The Fed’s goal is to depress aggregate demand enough, with the help of a loosening supply chain, to return inflation to a more reasonable and stable level, all while doing their best to side-step a potential recession…. not an easy task.
The result of the Fed’s policy decisions has been a sharp increase in interest rates across the yield curve. Focusing just on the U.S. 10-year treasury, yields have climbed from approximately 1.5% at year end to as high as 3.94% in September, resulting in a YTD loss of more than 14% for the benchmark Bloomberg Aggregate Bond index. Equity markets have experienced even steeper losses YTD, with the S&P declining by 23.87% (as of 9/30/22), while the growth-oriented NASDAQ Composite has declined by 32% over the same period, both landing in bear market territory (i.e., a peak-to-trough decline of 20%).
Despite these headwinds, markets managed a mid-summer rally of more than 17%, on hopes that the Fed had done enough and would be able to “pivot” away from their current policy actions in the not-so- distant future. However, given current market and economic conditions, is this even plausible, or are investors clinging onto false hope? These are the questions we aim to address in this quarter’s Market Insights letter.
Can We Pivot Today?
Some define pivot as meaning that the Fed will pull a full reversal in policy, moving from raising interest rates to cutting, while others view a pivot as simply moving to a more neutral policy stance (i.e., holding rates steady). Regardless of the exact definition, it would imply that the Fed will be less restrictive at some point in the future.
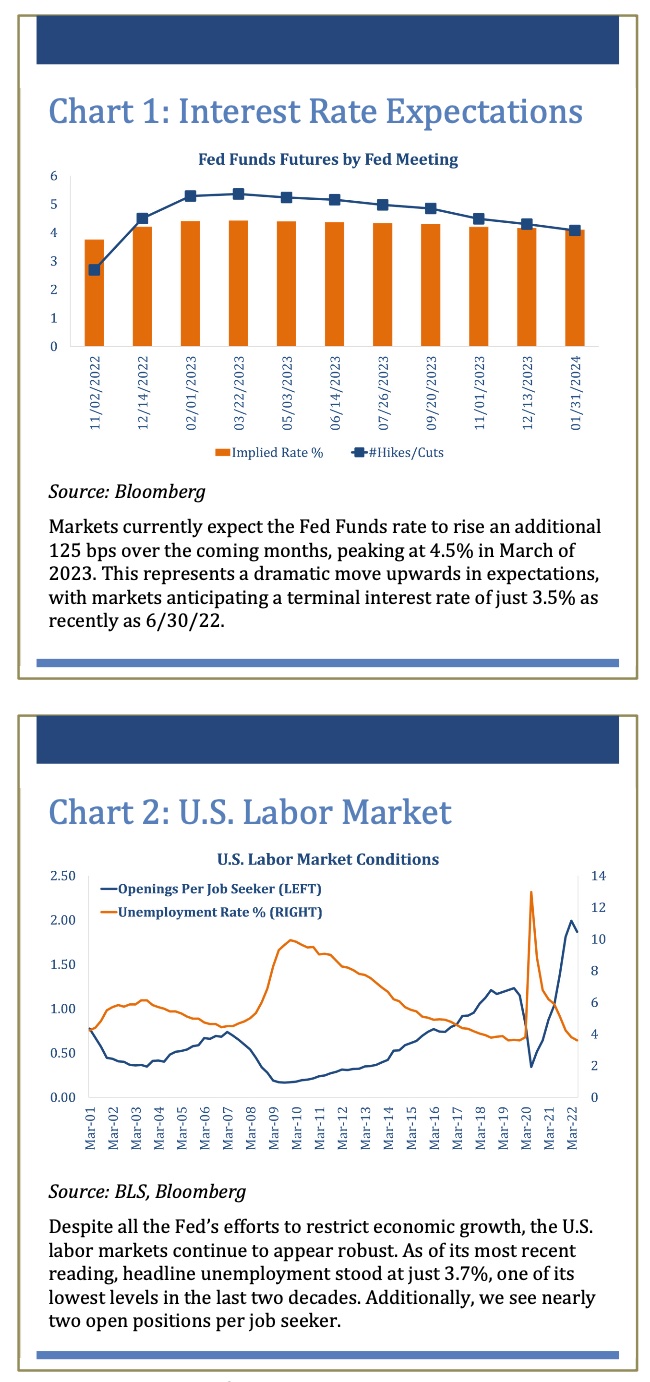
To get an indication of investors’ view on a pivot, we can look to the futures market, which directly prices in investor expectations for future interest rates. In Chart 1, we see that the market expects the Fed Funds rate to peak at 4.5% in March of 2023, before starting a gradual decline to approximately 4.3% at year end.
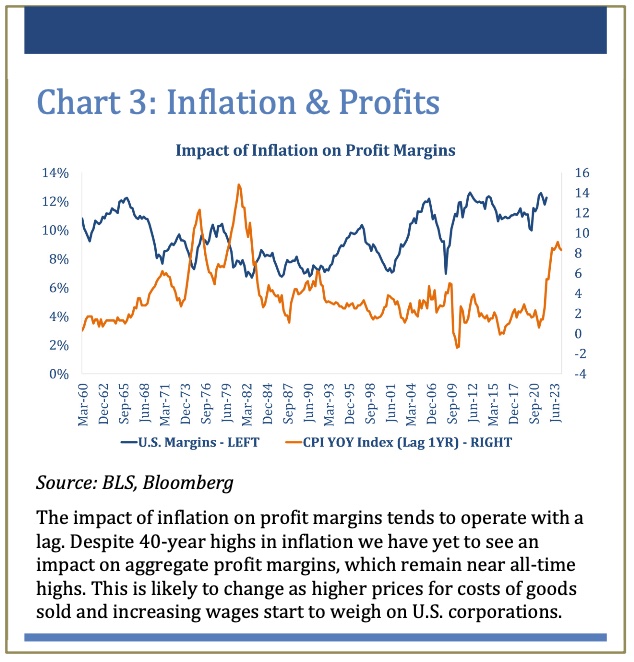
One important aspect of the Fed’s actions is that to have its desired impact of restricting economic growth it actually has to be restrictive. Up until the Fed’s September rate hike, the Fed Funds rate was still tracking below the “neutral” rate (i.e., rates were still accommodative), which some Fed governors have pegged as high as 3%. Others have argued that with inflation at over 8%, neutral may actually be much higher. That said, while it’s difficult to deny that a lag typically exists between changes in rates and their impact on the economy, we have yet to see any definitive proof that demand is weaking or that the economy is tightening in any meaningful way. We see clear evidence of this in the state of the labor market, which to say it remains strong would be an understatement. Not only do we have unemployment running at 3.7% (near full employment), but we have a great deal of tightness in the market, with nearly two jobs available for each job seeker (See Chart 2). As a result, current and prospective workers are left in a strong position, where they are able to demand higher wages, a figure we’ve seen grow by 5.2% on a year-over-year basis (as of August 2022). This creates a serious problem for the Fed’s inflation battle, as it introduces the threat of a wage- price spiral. This would be a situation where higher wages result in higher input costs for companies, which are eventually passed on to the consumer in the form of higher prices for goods and services. Put more simply, it’s a potentially vicious cycle of higher prices and is something the Fed hopes to avoid at all costs. But just where does this disconnect between the Fed’s action and labor markets come from?
Despite how hard they may try, there are a few factors that have been working against the Fed and actually loosening financial conditions. Starting with equity markets, excluding their near 24% decline thus far in 2022, stocks have created a massive positive wealth effect for investors of all shapes and sizes. Outsized gains have been experienced by both passive index investors in something like an S&P 500 index fund, which appreciated by more than 350% over the 10 years ending 12/31/2021, as well as those who reaped shorter-term gains riding the post-COVID technology or Meme stock wave. This positive wealth effect was further inflated by home price appreciation, with the median existing home price growing by more than 40% since 12/31/2019. While home price gains don’t put money directly into your bank account like realized stock market gains, it does make homeowners feel wealthier, and affords them access to a greater degree of home equity for potential spending.
Lastly, corporate credit markets have also contributed to loose financial conditions. This may sound counterintuitive, given the spike in interest rates we’ve experienced and their direct impact on borrowing rates. However, when we look at the actual spreads that corporate borrowers are paying above treasuries, they are average at best. Given past environments, one would expect credit spreads (especially for low quality borrowers) to have been pressured upward by equity market volatility and recession concerns. As of yet, this has not been the case during our current cycle.
Taking this tug of war between the Fed and other factors into account, it makes orchestrating a pivot under these conditions quite difficult and likely counterproductive, particularly with headline inflation still tracking at over 8% on a year-over-year basis.
Catalysts for a Pivot
Under a true pivot, where monetary policy shifts from restrictive to stimulative, the Fed’s goal would be to increase demand…meaning that demand has been diminished enough that inflation has subsided, and the economy requires external support to return to a healthy level. Getting to this state has the potential to be painful for consumers and investors. This is accomplished only by increasingly restrictive Fed policy leading to a decline in economic activity and losses in jobs and spending, a destruction of wealth created by declines in asset markets, or some combination of these events. Put more simply, to effectively tackle inflation some damage needs to be done in for the form of financial tightening…regardless of where it comes from. But the end result needs to be a clear change in consumer behavior… less spending, less demand, less hiring, and finally lower inflation.
From the Fed’s standpoint, they appear to be holding up their end of the bargain, increasing rates aggressively over the last six months, with rate increases expected to continue into mid-2023. This will no doubt work toward tightening financial conditions, especially as the Fed Funds rate moves further into restrictive territory. Turning to equities, recent stock market declines have undoubtedly been supportive of the Fed’s tightening agenda, but they have yet to reach a level that has altered consumer behavior and correspondingly allowed the Fed to sway their policy direction. The important question then becomes, how much farther do we need to fall before the Fed considers pivoting toward looser monetary policy and, additionally, what is the catalyst for a potential next leg down in equity prices?
Equities have struggled thus far in 2022, as inflation and higher interest rates have put downward pressure on stock prices. These losses, however, have largely come in the form of a valuation reset, not necessarily a widespread decline in earnings. We can take this to imply that recent stock price declines alone are unlikely enough to concern the Fed, given how elevated valuations were to start the year and where they stand today. Earnings, unlike valuations, operate with a lag, as it takes some time for higher input prices and decreasing demand to impact profit margins and inevitably earnings (See Chart 3). As such, aggregate earnings for the S&P 500 have yet to experience any type of meaningful setback, with current estimates showing a 9% year-over-year gain for Q3 and a 13%1 increase for calendar year 2023. But are these figures realistic, especially with the apparent risk of at least a mild recession on the horizon?
Looking back to 1950, the National Bureau of Economic Research (NBER) has called 11 recessions, which have varied greatly in terms of depth and length. Taking a simple average of peak-to-trough earnings declines during these periods, we find an average EPS decline of 26% (15% if we exclude the tech bubble and great financial crisis). For the sake of our analysis, we’ll assume that our base-case scenario aligns with the 15% long-term average (excluding extremes) and that companies are able to pass on some of their increased costs to consumers, leading to a negative impact on margins and some reduction in consumption. For our worst-case scenario, which we view as somewhat unlikely, we’ll assume a 26% decline in earnings, where wages and input costs weigh heavily on margins, while consumer demand wanes at the same time. And finally, our goldilocks scenario would be flat earnings growth, where consumption remains robust and diminishing profit margins are offset by continuing demand. While this final scenario may sound optimistic, keep in mind that this is still much more bearish than current analyst expectations of 13% for year-over-year EPS growth in 2023.
The Path to a Pivot (and Fair Value)
Coming into 2022, the trailing 12-month (TTM) P/E ratio on the S&P 500 stood at roughly 24x, equating to a 20% premium over its 50-year average of 20x and a 40% premium to the long-term average of approximately 17x. At the same time, earnings for the S&P 500 were about 35% above their 25-year trend. While we’ve since seen the TTM P/E decline to a low near 20x, amidst the recent market decline, earnings have continued to grow (albeit likely peaking in Q1 of 2022). This has created a partial negative wealth effect, which is supportive of the Fed’s agenda, but still leaves valuations and earnings above average. That said, how much farther do we potentially need to fall for equities to reach a level of fair value?
To answer this question, let’s walk through each of our scenarios, assuming that peak earnings occurred in the March quarter of 2022 and that they will decline linearly over the next 12 months. Starting with our worst-case scenario, where we expect an earnings decline of 26%, the S&P 500 would need to decline by ~35% to reach the long-term average P/E, and 20% to approach the 50-year average P/E. Our best-case scenario is clearly more optimistic, however unlikely. Here we assume earnings remain flat over the next 12 months, which requires a price decline of ~10% to reach a P/E of 17x and flat returns to stand near 20x. Lastly, for our base case, we assume an EPS decline of 15% over the next 12 months. Under this scenario, we reach our respective fair value estimates with a decline of 10-25%. Which scenario is most likely?
Unfortunately, that’s a difficult question to answer and largely depends on how softly the Fed engineers its landing and how quickly inflation normalizes. That said, looking at our various scenarios, along with our assumptions for fair value on the S&P 500, further declines in the 10% to 20% range do not appear to be out of the realm of possibility, while flat (or positive) returns from current levels seem rather unlikely. While this sounds uncomfortable for investors, when coupled with aggressive Fed policy, it may be the ingredient necessary to tighten fiscal conditions enough to alter behavior, break the back of inflation, and lead us toward an eventual pivot.
Conclusion
In this quarter’s letter we addressed the much-debated topic of the Fed “pivot”. Unfortunately, based on the current strength of labor markets, equity market valuations that are still above average, and stubbornly high inflation, more will likely need to be done to press down on the demand side of the inflation equation in order to return prices to more stable levels. To the dismay of investors this is unlikely to come without pain, in the form of continued equity market volatility. However, there is a bright side to higher yields for bonds and lower valuations for equities…returns going forward look much more appealing than they did just 9 months ago and much closer to their long-term historical averages, as we’ve begun the
process of correcting the excesses of the last decade.

Starting with bonds, yields tend to be highly predictive of future longer-term returns, and at a yield of over 3.8% on the U.S. 10-year treasury, your future return potential is greatly improved compared to 9 months ago. While equities have the potential for heightened volatility, recent losses and a retracement in valuations have greatly increased our future return outlook for U.S. stocks, especially when compared to the dismal return forecasts we projected at the start of the year. In just the last 9 months, we’ve seen our 10-year annual return forecast for the S&P 500 improve from -3% at year-end 2021 to over 4.5% today.
So what should investors do from here? While it may sound simple and self-explanatory, we would recommend investors remain disciplined and diversified, despite the potential for increased equity volatility. The most sound strategy, regardless of the market environment, is to develop an investment plan based upon your risk tolerance and return objective and not stray from that plan, even when market volatility makes it tempting to do so. And to end on a positive note, while 2022 has been difficult environment for fixed income and equity investors alike, the valuation reset that appears to be in its latter innings greatly improves our long-term return outlook for assets across the globe. As always, thank you for your continued trust and confidence.
Market Insights is intended solely to report on various investment views held by Integrated Capital Management, an institutional research and asset management firm, is distributed for informational and educational purposes only and is not intended to constitute legal, tax, accounting or investment advice. Opinions, estimates, forecasts, and statements of financial market trends that are based on current market conditions constitute our judgment and are subject to change without notice. Integrated Capital Management does not have any obligation to provide revised opinions in the event of changed circumstances. We believe the information provided here is reliable but should not be assumed to be accurate or complete. References to specific securities, asset classes and financial markets are for illustrative purposes only and do not constitute a solicitation, offer or recommendation to purchase or sell a security. Past performance is no guarantee of future results. All investment strategies and investments involve risk of loss and nothing within this report should be construed as a guarantee of any specific outcome or profit. Investors should make their own investment decisions based on their specific investment objectives and financial circumstances and are encouraged to seek professional advice before making any decisions. Index performance does not reflect the deduction of any fees and expenses, and if deducted, performance would be reduced. Indexes are unmanaged and investors are not able to invest directly into any index. The S&P 500 Index is a market index generally considered representative of the stock market as a whole. The index focuses on the large-cap segment of the U.S. equities market.
