
By Eric Kazatsky, Clark Capital Management Group
The municipal bond sector is not immune to volatility in energy prices, specifically, the recent declines in per barrel price of oil. While the price of oil has slowly rebounded from the lows in 2016, October 2018’s per barrel price decline harkens back to December of 2014.
Growing oil production in the U.S. combined with the uncertain impacts of Iranian sanctions could signal continued volatility in oil movement and capped upside for the foreseeable future. However, the degree of impact on municipal bonds can be varied, with falling oil prices creating potential headwinds for state level credits and a slight tailwind for revenue backed transportation bonds.
State Level Swings
Individual states’ reliance on oil pricing can be quite diverse. States who are most dependent on oil production and associated industries can see their fortunes rise and fall in line with per-barrel crude prices.
One way that states monetize their exposure to the energy industry is through severance taxes, with Alaska, Louisiana, Montana, New Mexico, North Dakota, Texas and Wyoming making the list of impacted areas. Alaska leads the way in terms of states that are dependent upon severance taxes, while Louisiana and Texas fall to the bottom of the rankings.
| Oil & Gas Extraction as % of GSP | Count | States |
|---|---|---|
| 8%+ | 5 | AK, WY, TX, OK, LA |
| 3% – 7.99% | 3 | NM, ND, CO |
| 1%-2.99% | 6 | MS, AR, UT, CA, MT, WV |
| 0.01%-0.99% | 13 | KS, AL, PA, OH, KY, NE, ID, IL, SD, VA, MI, IN, MN |
| 0%-0.01% | 19 | TN, NY, FL, NV, MO, HI, AZ, WI, RI, OR, MA, CT, DE, IA, ME, NH, VT |
| Not Reported | 4 | GA, WA, MD, SC |
Implications for Investors
So what does this mean for municipal bond investors? Credit spreads for oil dependent states such as Alaska and Louisiana for example, tend to move inversely to per-barrel price movements in oil.
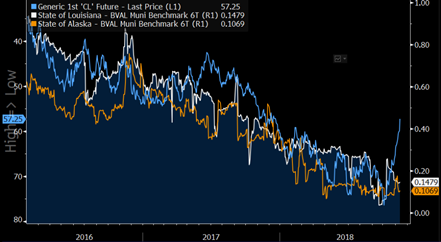
While oil pricing declined post 2014, spreads in each these two states widened as their finances came under pressure. Conversely, spreads in both states have steadily tightened as oil rebounded off the $30 lows of mid-2016. This makes the current break in the relationship between oil and muni spreads all the more interesting, as oil has fallen almost $20/barrel and spreads for both Alaska and Louisiana remain near their lows.
How much of this is due to supply/demand dynamics in the tax-exempt market is hard to parse out; however, a persistent range bound level for oil or even a leg lower, could provide cheaper entry points into the state debt for each of these entities.
Fuel Prices and the Retail Consumer
When looking at revenue backed transportation credits, we can point to a historical relationship between periods of declining oil prices and a corresponding decline in both retail gas prices and aviation fuel prices.
