
Canterbury just completed its 2022 year end review. A link to that video can be found below. The video discusses the causes of the bear market we saw last year, as well as how the Portfolio Thermostat navigated the difficult market.
Markets ended last week with another outlier day (a trading day beyond +/-1.50%). After having 77 outlier days in 2022 (which is the third most outliers for a single year since 1950), there have been three outlier days so far in 2023. During a typical year that exhibits normal, rational behavior, the S&P 500 is expected to have around ten to twenty outlier days. Remember, the markets did not enter into 2023 during a normal, rational market environment.
That being said, volatility has begun to fall in recent weeks, as the markets moved sideways in late December, and rose slightly into the new year. Right now, the S&P 500 sits at a point of previous resistance: its 200-day moving average of price.
The 200-day moving average has been a point of contention for the market throughout this bear market period. Each time that the index has hit the moving average, it has bounced off and headed lower. This was the case back at the market’s peak in August, as well as a few weeks ago.
Back in August, the index went up against its 200-day moving average and failed, falling -17% to its low point October. In mid-December, the index yet again hit the moving average, before opening above it, and falling -6% in just four days.
Will this time be any different? One factor that does seem to be different this time around, compared to August, is market leadership. “Growth” sectors such as Information Technology, Consumer Discretionary (Amazon and Tesla), and Communications are what lead the market’s volatility last year and drove the index lower. At the market’s peak in August, when it was sitting at its 200-day moving average of price, these sectors had led a bear market rally to that point. In other words, the “dogs” had their day. Now, after the market has sold off to its lows, and rallied back to its 200-day moving average, the rally has been led by “value” oriented sectors, which were less volatile than Growth stocks last year.
The chart below shows the S&P 500 with its 200-day moving average. The lower half of the chart displays the relative strength of Value versus Growth. When the line is rising, Value is outperforming Growth. When the line is falling, Growth is outperforming Value.
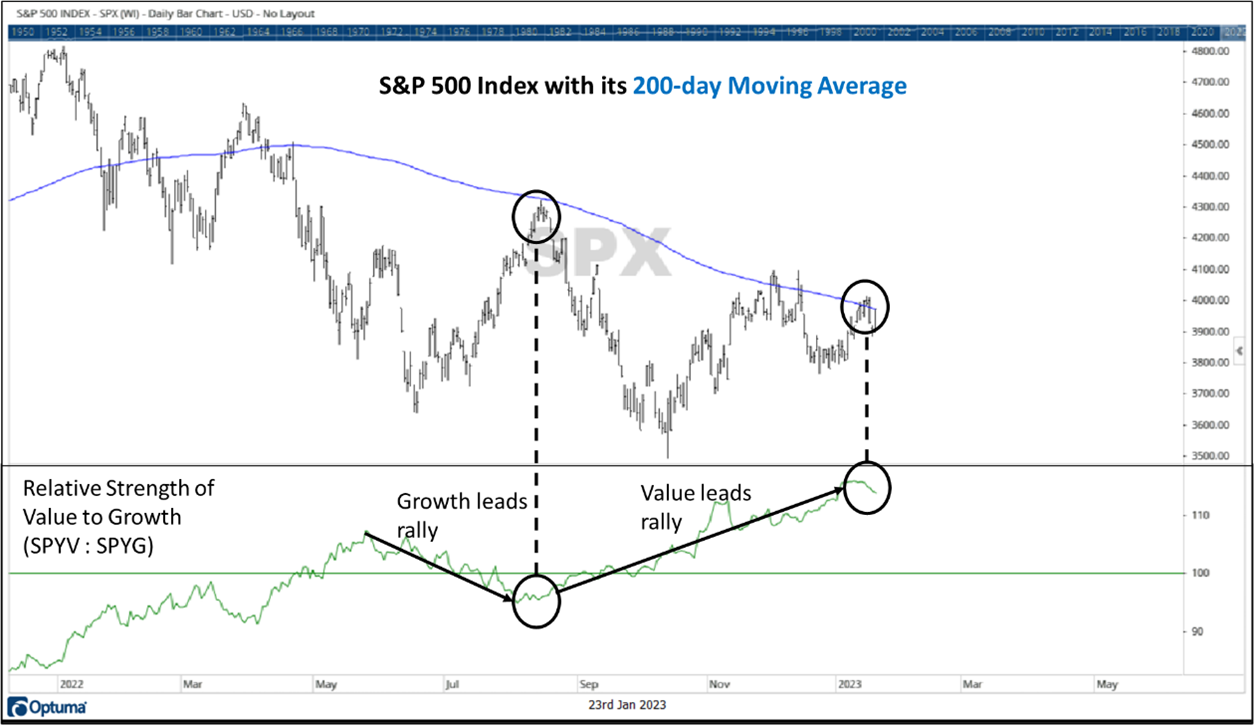
Source: Canterbury Investment Management. Chart created using Optuma Technical Analysis Software
Bottom Line
So far, the S&P 500’s 200-day moving average continues to be a resistance point for the index until proven otherwise. Volatility has fallen off some in recent weeks, but does remain high. The next few weeks will be interesting as companies begin to report Q4 earnings. During a volatile market, and one up against resistance, even the slightest “beat” or “disappointment” in earnings could cause a wave of short-term fluctuations, in either direction, particularly in tech stocks.
For more news, information, and analysis, visit the ETF Strategist Channel.
