
A year ago, most people outside the ETF ecosystem had probably never heard of ARK Invest. Sitting at $3 billion in assets at the end of 2019, ARK was the 31st largest ETF provider largely known for its concentrated high-growth strategies. While the reputation of a high-growth-focused investment strategy has not changed, the firm has grown assets by 1,500% over the past 14 months and expanded to become the eighth largest ETF provider. ARK’s founder, Cathie Wood, is practically a celebrity who even has her own merch line.
ARK’s ETFs have seen incredible performance, largely attributed to Wood’s confidence in Tesla and other high-growth companies. The firm’s largest fund, ARKK, returned 152% in 2020! But macro trends have also contributed to ARK’s rise over the past year — and those trends may be heading for reversal.
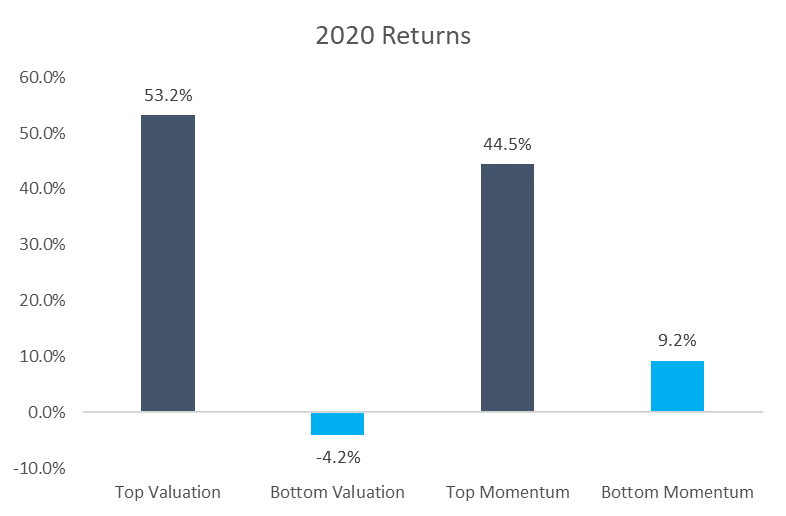
To examine the factors that have contributed to ARK’s success, we can use S&P 500 constituents for analysis and divide the universe into deciles by particular factors. Beginning with valuations, 2020 was a dramatic year for the performance spread between cheap and expensive companies. In fact, by some accounts it was the largest gap ever in a single year. The second factor that contributed to ARK’s outperformance was momentum. Similar to valuations, 2020 saw dramatic spreads between performance of stocks with high and low momentum.
Source: Morningstar
The chart above shows that the 50 highest-valuation companies in the S&P 500 at the end of 2019 outperformed the 50 lowest-valuation companies by more than 57%. Maybe even more alarming is the spread in price-to-earnings ratios of the two groups; the expensive stocks were 31 times the value of the cheapest. It also shows that the spread between the top and bottom momentum stocks was over 35%. These stocks also tended to be of higher valuations. Both trends helped boost ARK’s suite of ETFs with five out of the eight ETFs seeing returns over 100% in 2020, despite lofty valuations.
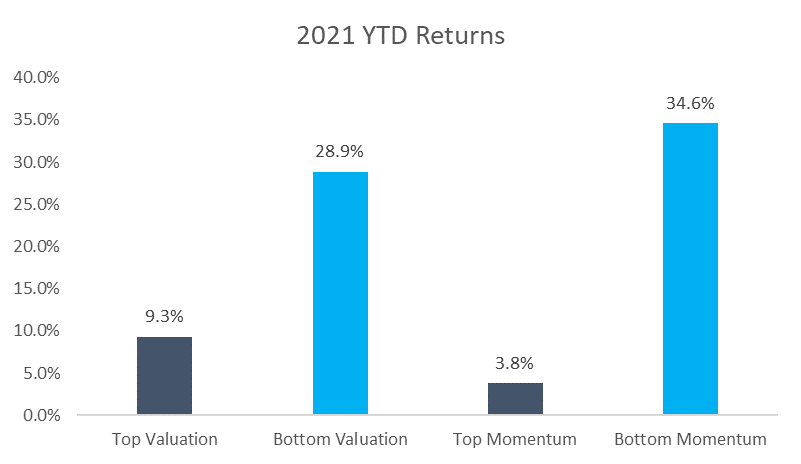
So far in 2021, while ARK has been the topic of much discussion given its growth as a firm, some of its strategies haven’t performed as well. Again, we can look to the previous two factors as a potential guide. See below the same study for valuations and momentum so far this year, through March 15.
Source: Morningstar
These charts show the trends have completely reversed. Cheap stocks have outperformed expensive ones by nearly 20%, and low-momentum stocks have outperformed high-momentum stocks by more than 30%.
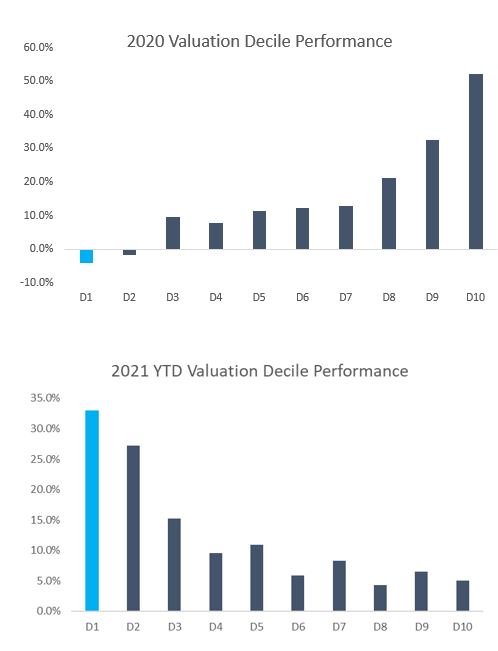
To further illustrate the reversal in factor performance, the charts below show each of the particular deciles for valuations and their corresponding return for 2020 and so far in 2021. D1 corresponds to the cheapest decile (50 stocks) while D10 corresponds to the most expensive.
Source: Morningstar
Not only can you visualize the spread from D1 to D10, but it’s nearly a perfect glide path with a complete reversal between 2020 returns and what we have seen so far this year. Whether or not these trends will persist is anyone’s guess, but for the first time in several years there has been meaningful outperformance by value. Yields continuing to rise and economic activity increasing as the world recovers from the pandemic could prove to be the tailwinds that value’s sails need after being battered for years. Could a value recovery mean rough waters ahead for ARK? Only time will tell.
1038-CLS-3/26/2021
