
By Rod Smyth, Chairman of the Board of Directors, and Kaetlin Collins, CFA, Associate Portfolio Manager
Millennials/Gen Z: The sooner you think about retirement, the easier it is to save enough.
SUMMARY
- Start Young
- Contribute as much as you can
- Be willing to take risk as time is on your side
- Don’t get emotional about your statements
Ask yourself this question: What is risk?
a. Watching your investment portfolio lose 20% or more of its value.
b. Investing in highly volatile stocks.
c. Not having enough money to retire.
In our view, the answer is ‘C’, followed by ‘B’ and ‘A’. If you are a patient long-term investor, price volatility is a temporary problem, but not having enough money to retire is a life-changing one. Clearly, watching your hard-earned savings falling in value feels awful at the time, but if stocks continue to appreciate over time, then a decline in stocks could be an opportunity to buy at lower prices.
The chart below shows the history of US Large Cap stock returns since 1926, including dividends and taking away inflation. Looking at returns net of inflation is very important in our view since goods and services are likely to cost more 30-40 years from now. We need to plan for understanding what our savings will be able to purchase in the future.
The direction is up, but the path is unpredictable.

Source: RiverFront Investment Group, calculated based on data from CRSP 1925 US Indices Database ©2021 Center for Research in Security Prices (CRSP®), Booth School of Business, The University of Chicago. Data from Jan 1926 through Aug 2021. Past performance is no guarantee of future results. It is not possible to invest directly in an index. RiverFront’s Price Matters® discipline compares inflation-adjusted current prices relative to their long-term trend to help identify extremes in valuation. Blue line represents the Large Cap Real Return Index. Yellow line represents the Annualized Real Trend Line of Large Cap Real Total Return Index according to Price Matters®. Shown for illustrative purposes only, not indicative of RiverFront portfolio performance. Information or data shown or used in this material was received from sources believed to be reliable, but accuracy is not guaranteed. The chart above uses a logarithmic scale. Line movements will be dampened/subdued based on the exponential y-axis.
There are a few takeaways from looking at this chart, in our view.
- The trend (solid gold line) has historically risen at 6.4%.
- Due to volatility and starting point, investors’ experience very different returns over shorter time frames.
- Stocks can stay above and below trend for long periods of time.
- One dollar invested in 1926 has risen over 500x net of inflation.
Looking also at the underlying monthly data, the following stats may be helpful. In all the 3-year rolling periods stocks have risen around 75% of the time and in 5 and 10-year rolling periods they rise around 85% of the time. Also remember that someone who invests a little each month can take advantage of market declines.
The Tortoise or the Hare
If you have had success investing in individual stocks, perhaps more speculative ones, 6.4% returns over inflation may not seem very exciting. Our advice is not to be greedy. More speculative investing in a limited number of financial assets during a bull market can be rewarding but also risky. However, in our experience there are relatively few investors who can repeat that success through multiple bull and bear cycles, and to do so takes considerable time and research. Thus, rather like Aesop’s fable about the tortoise and the hare, we believe, when it comes to retirement investing, a diversified portfolio (tortoise) rather than a speculative portfolio (hare) is a wiser choice over time.
The Paradox of Youth: Why taking risk is ‘less risky’ and starting young may make a bigger difference than you think
Recognizing that each saver has their own unique circumstances, RiverFront’s general advice for someone starting to save for retirement can be boiled down to six bullets:
- Start as young as possible and save whatever you can afford.
- If you can, save 5-10% of your salary every year on a bi-monthly basis in a tax deferred account.
- If you can’t afford 5-10%, then anything is better than nothing.
- Maximize any employer matching in a 401k, 403b.
- We suggest primarily owning stocks in a diversified portfolio until the ‘sustain phase’ (10 years prior to retirement).
- Don’t get emotional about your statements: You are buying every month; while rising prices feel good, falling prices allow you to buy at lower levels.
The ‘paradox’ is that some or all of these ‘rules’ can be most difficult when you are young. When you are starting out, saving 10% of salary can be a tall order when the essentials take up most of your income. Retirement may well be the last thing on your mind in your 20s and early 30s, but as we will show, the choices made early on potentially have a big impact.
Also, as we discussed earlier, we believe not investing in stocks is a greater risk to retirement success than experiencing temporary downside. In the next section we will seek to quantify the risk to your retirement of ‘playing it safe’. We think the numbers discussed below will surprise and perhaps amaze many of you, so please read on.
Disclaimer: This piece is about retirement saving. It is impossible to try and write about the many different scenarios that people face through life with their saving/spending choices. There are many unknowable variables to consider: two incomes versus one, marriage, divorce, children, saving for education costs, saving for a house purchase… the list goes on. If ‘death and taxes’ are the two certainties in life, a highly probable third is retirement, hence its importance. We think the trade-offs should be considered and understood as early as possible.
We use the example of a 401k (a company sponsored retirement plan) as it is the vehicle used by many, but the same basic rules apply to those working for non-profits whose choice is referred to as a 403b, or someone saving in a tax-deferred way through some form of an Investment Retirement Account (IRA). In saving for retirement, we believe a tax-deferred plan is going to be the best option for most people. Finally, the examples below focus on the younger investor (25-35), but we think the same principals apply to any investor with a 20, 30 or 40-year planning horizon. Retiring at 65 is just used for our illustration.
To bring these rules to life, we have tried to put some numerical values in the tables below to show their significance, using hypothetical examples. To do this, Kaetlin Collins, one of our millennial-age associate portfolio managers who is passionate about educating her generation, built a “retirement calculator” for a 401k plan which we will use to illustrate the first 3 rules. The main inputs are:
- Starting Salary (Gross)
- Paychecks Per Year
- Employee Contribution
- % Invested In Stocks
- Company Match
- Starting Age
- Retirement Age
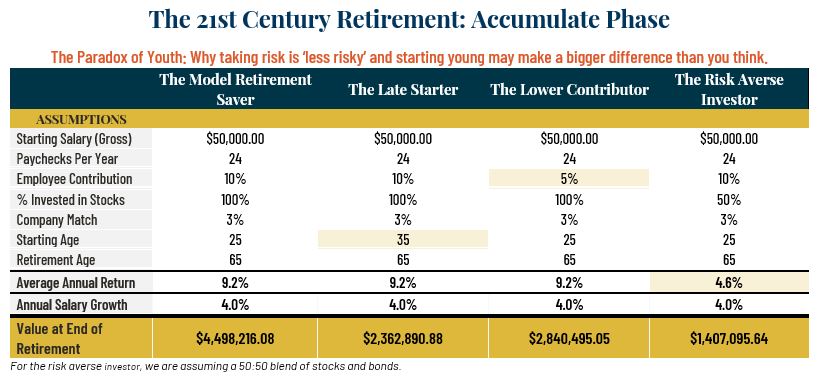
The table above seeks to quantify the opportunity cost of starting later, contributing less, and being risk averse. We think the numbers speak for themselves.
Our Model Retirement Saver ends up with $4,500,000 million.
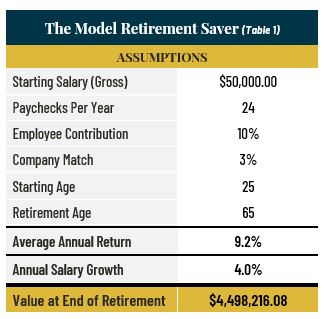 The examples above are purely an illustration to make a point, but we have tried to make them realistic. Our “model retirement saver” is someone who starts saving at 25, saves 10% of their salary monthly, and seeks to retire at 65 (we are assuming a starting annual salary of $50,000 in line with the average of the millennial generation). Our model saver invests 100% in stocks at a return of 9.2%. We use this rate of return as US stocks have risen at an average rate of 9.2% (before inflation) since 1880 (source: Goldman Sachs). We are also assuming salary growth of 4%, which is two times the Federal Reserve’s targeted long-term inflation rate. Finally, we are assuming a company match of up to 3% of salary.
Plans vary widely, but this is consistent with US norms. We urge all savers to take advantage of any company match in a 401k/403b if possible. Doubling your money is not easy in markets, but when a company matches your contributions, that is exactly what happens up to the amount matched. After 40 years, the model saver’s portfolio in our example is worth $4,498,216, shown in the first table.
 Rule 1: Start Young.
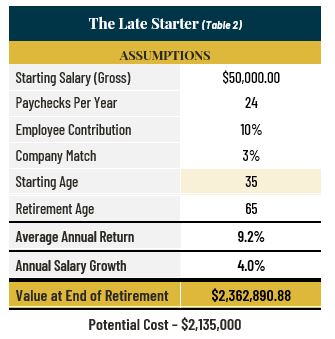
To illustrate the value of starting early, we will keep everything constant except the starting age which will now assume is 35, by which time our late starter’s salary has grown from 50,000 to $74,000. The results are shown in table 2.
The Late Starter: Potential Cost – $2,135,000
The first 10 years of the model saver’s personal contributions are just $60,000, and yet the cost in terms of returns of starting 10 years later, in this hypothetical example, is approximately $2.1 million. This illustrates the power of compounding 9.2% returns over 40 years versus 30. To many people this result is shocking. As noted above, we recognize the challenge of saving 10% of salary at age 25. However, knowing the potential rewards might well make you a better saver.
 Rule 2: Contribute as much as you can.
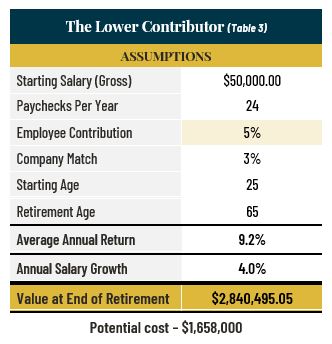
To illustrate the value of a higher contribution rate, we will return to our original model, only this time we will drop the contribution rate to 5%. The results are in table 3.
The Lower Contributor: Potential Cost – $1,658,000
As you would expect, given the lower contribution rate the final number is lower in this case by approximately $1.7 million. However, look at the comparison with the late starter. Starting earlier and saving for an extra 10 years, even with half the contribution rate, results in a bigger number at age 65…perhaps another surprise result. Regardless of age, the message here is to contribute what you can afford and start as soon as possible.
 Rule 3: Be willing to take risk as time is on your side.
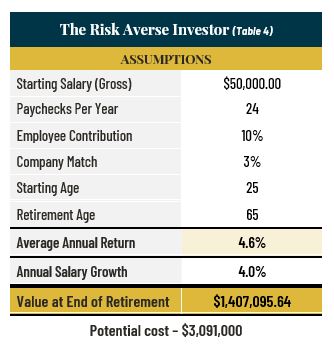
For this illustration (table 4) we will return to our model saver who saves 10% and starts at age 25, but this time our investor only invests 50% of their money in the stock market. In the current interest rate environment, we are assuming the other 50% has a zero return, net of inflation. This may even be generous as the US Treasury’s Inflation Protected Securities (TIPS) at the time of writing have negative yields for all maturities out to 2050; and money market yields are close to zero and so well below the inflation rate.
The Risk Averse Investor: Potential Cost – $3,091,000
Understand that ‘safety’ or ‘risk aversion’ can have a price: This is perhaps the most important lesson of all, in our opinion. The paradox is that we believe you put your retirement at greater risk by playing it safe, especially in the early years when you have the longest timeframe. As you get closer to retirement, managing risk becomes more important. Of all the rules and their consequences, it might surprise you that in the current
interest rate environment being risk averse can cost you a lot more than either making a lower contribution or starting later. Even though our risk averse investor is just as diligent as the model saver, their final amount is $3.1 million lower. This all leads to rule 4.
Rule 4: Don’t get emotional about your statements.
One thing we can predict with considerable certainty is that a saver who invests in stocks over 40 years is going to experience market declines, some significant in both magnitude and duration. Thus, there will be times when opening your statements won’t feel good.
We cannot know what the future holds nor the timing of the next sharp or prolonged decline (bear market). However, our earlier chart includes wars, the Great Depression, the inflation of the 1970s, the bursting of the late 1990s tech bubble, the market collapse of 2008 and now a pandemic. The investor willing to endure those challenging times has been rewarded.
As long as you believe companies will continue to grow earnings and dividends over the long term and that their share prices will reflect that growth, then persistence will pay off. Our advice is to trust the process. If you are willing to own stocks, don’t be disheartened by the market value on your monthly statement at times along the way.
Conclusion:
The purpose of this piece is to provoke thoughts about choices and give guidance. We hope it will promote discussions among younger investors and those that they trust for advice and counsel. We recognize that there will be readers who don’t have a formal relationship with a financial advisor, and we encourage you to explore what that relationship could do for you.
Important Disclosure Information
The comments above refer generally to financial markets and not RiverFront portfolios or any related performance. Opinions expressed are current as of the date shown and are subject to change. Past performance is not indicative of future results and diversification does not ensure a profit or protect against loss. All investments carry some level of risk, including loss of principal. An investment cannot be made directly in an index.
Chartered Financial Analyst is a professional designation given by the CFA Institute (formerly AIMR) that measures the competence and integrity of financial analysts. Candidates are required to pass three levels of exams covering areas such as accounting, economics, ethics, money management and security analysis. Four years of investment/financial career experience are required before one can become a CFA charterholder. Enrollees in the program must hold a bachelor’s degree.
Information or data shown or used in this material was received from sources believed to be reliable, but accuracy is not guaranteed.
This report does not provide recipients with information or advice that is sufficient on which to base an investment decision. This report does not take into account the specific investment objectives, financial situation or need of any particular client and may not be suitable for all types of investors. Recipients should consider the contents of this report as a single factor in making an investment decision. Additional fundamental and other analyses would be required to make an investment decision about any individual security identified in this report.
Index Definitions:
U.S Market Cap index information calculated based on data from CRSP 1925 US Indices Database ©2021 Center for Research in Security Prices (CRSP®), Booth School of Business, The University of Chicago. Used as a source for cap-based portfolio research appearing in publications, and by practitioners for benchmarking, the CRSP Cap-Based Portfolio Indices Product data tracks micro, small, mid- and large-cap stocks on monthly and quarterly frequencies. This product is used to track and analyze performance differentials between size-relative portfolios. CRSP ranks all NYSE companies by market capitalization and divides them into ten equally populated portfolios. Alternext and NASDAQ stocks are then placed into the deciles determined by the NYSE breakpoints, based on market capitalization. The series of 10 indices are identified as CRSP 1 through CRSP 10, where CRSP 10 has the largest population and smallest market-capitalization. CRSP portfolios 1-2 represent large cap stocks, portfolios 3-5 represent mid-caps and portfolios 6-10 represent small caps.
The Real Return is the annual percentage return realized on an investment adjusted for inflation. Trend, according to Price Matters® is the slope of an exponential growth function that closely tracks a real (inflation-adjusted) long term Index for that Asset Class. Distance from Trend is the distance of the trend line relative to the current index level expressed as a percentage.
Important Risk Considerations:
Stocks represent partial ownership of a corporation. If the corporation does well, its value increases, and investors share in the appreciation. However, if it goes bankrupt, or performs poorly, investors can lose their entire initial investment (i.e., the stock price can go to zero). Bonds represent a loan made by an investor to a corporation or government. As such, the investor gets a guaranteed interest rate for a specific period of time and expects to get their original investment back at the end of that time period, along with the interest earned. Investment risk is repayment of the principal (amount invested). In the event of a bankruptcy or other corporate disruption, bonds are senior to stocks. Investors should be aware of these differences prior to investing.
Technical analysis is based on the study of historical price movements and past trend patterns. There are no assurances that movements or trends can or will be duplicated in the future.
In a rising interest rate environment, the value of fixed-income securities generally declines.
Diversification does not ensure a profit or protect against a loss.
RiverFront Investment Group, LLC (“RiverFront”), is a registered investment adviser with the Securities and Exchange Commission. Registration as an investment adviser does not imply any level of skill or expertise. Any discussion of specific securities is provided for informational purposes only and should not be deemed as investment advice or a recommendation to buy or sell any individual security mentioned. RiverFront is affiliated with Robert W. Baird & Co. Incorporated (“Baird”), member FINRA/SIPC, from its minority ownership interest in RiverFront. RiverFront is owned primarily by its employees through RiverFront Investment Holding Group, LLC, the holding company for RiverFront. Baird Financial Corporation (BFC) is a minority owner of RiverFront Investment Holding Group, LLC and therefore an indirect owner of RiverFront. BFC is the parent company of Robert W. Baird & Co. Incorporated, a registered broker/dealer and investment adviser.
To review other risks and more information about RiverFront, please visit the website at www.riverfrontig.com and the Form ADV, Part 2A. Copyright ©2021 RiverFront Investment Group. All Rights Reserved. ID 1851962
