
The chance of a recession has increased.
Executive Summary
- Our Equity Model’s 6-month forecast for the S&P 500 dropped to a significant negative, -12.3%.
- Manufacturing and consumer spending have weakened, while the labor market remains strong.
Last year, we witnessed the worst market decline since 2008. This year began on a positive note, with the S&P rebounding by 6.3% in January. The market never goes a straight line. Counter-trend moves are common, as can be seen on this chart. Even in a terrible year for stocks such as 2022, there were three strong rebounds as investors experienced bouts of optimism for one reason or another.
The S&P 500, 1 Year
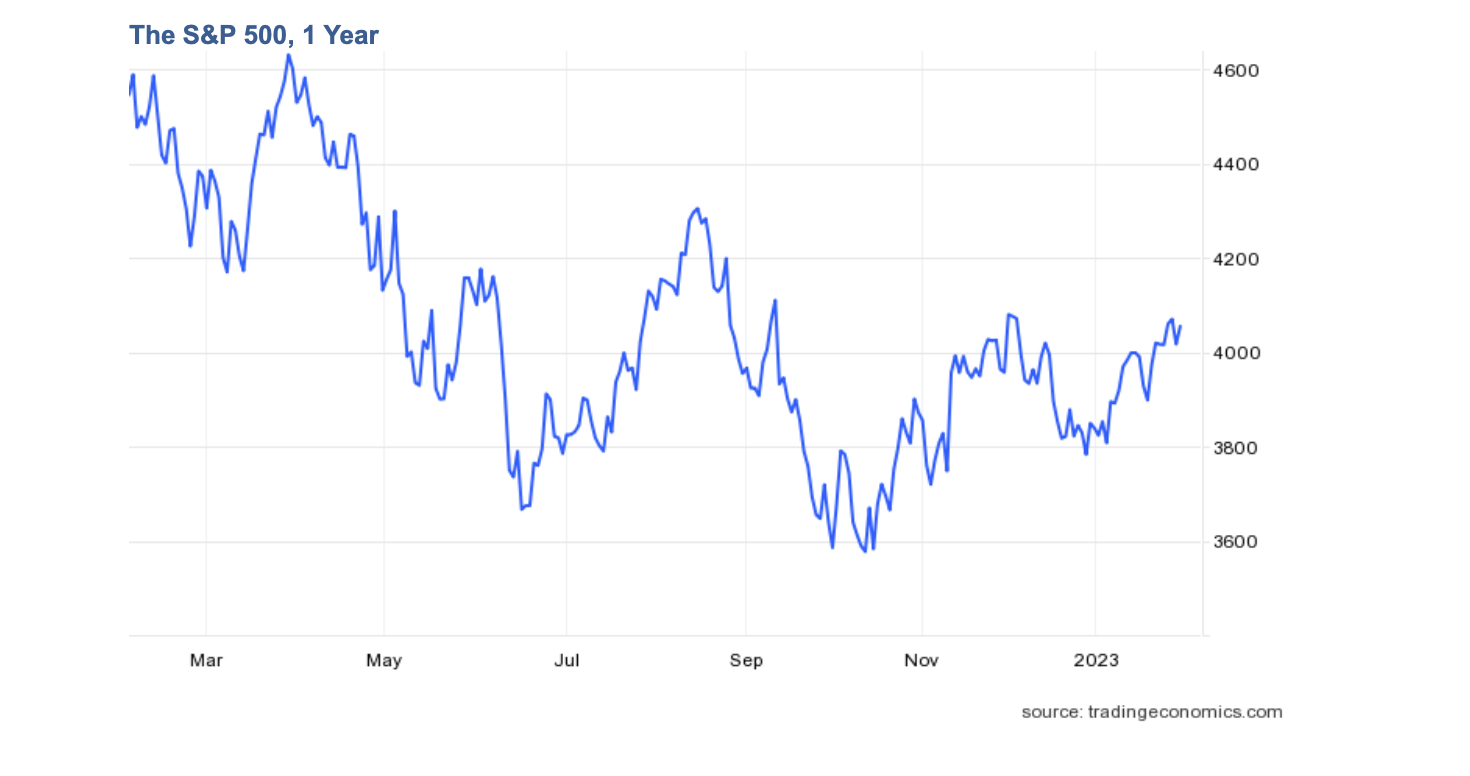
These fluctuations don’t change the trend. Our models expect significant further downside in the mid-term. The 6-month market forecast by our fundamentals-based model is now -12.3% – a highly negative level that’s reached infrequently, and lower than that of early-2022 (when it was -9.9% at the lowest).
Market Outlook
This section summarizes market forecast by our quant models. It is determined by data and computer code and is not subject to interpretation or emotion. I add qualitative “color” in the next section, Economic Update.
The 6-month forecast for the S&P 500 by our fundamentals-based statistical Equity Model continues to plunge, to 12.3%, from -6.8% last month. The decline was due primarily to higher market valuation as the index rebounded in January. The model remains in “Bearish” stance.
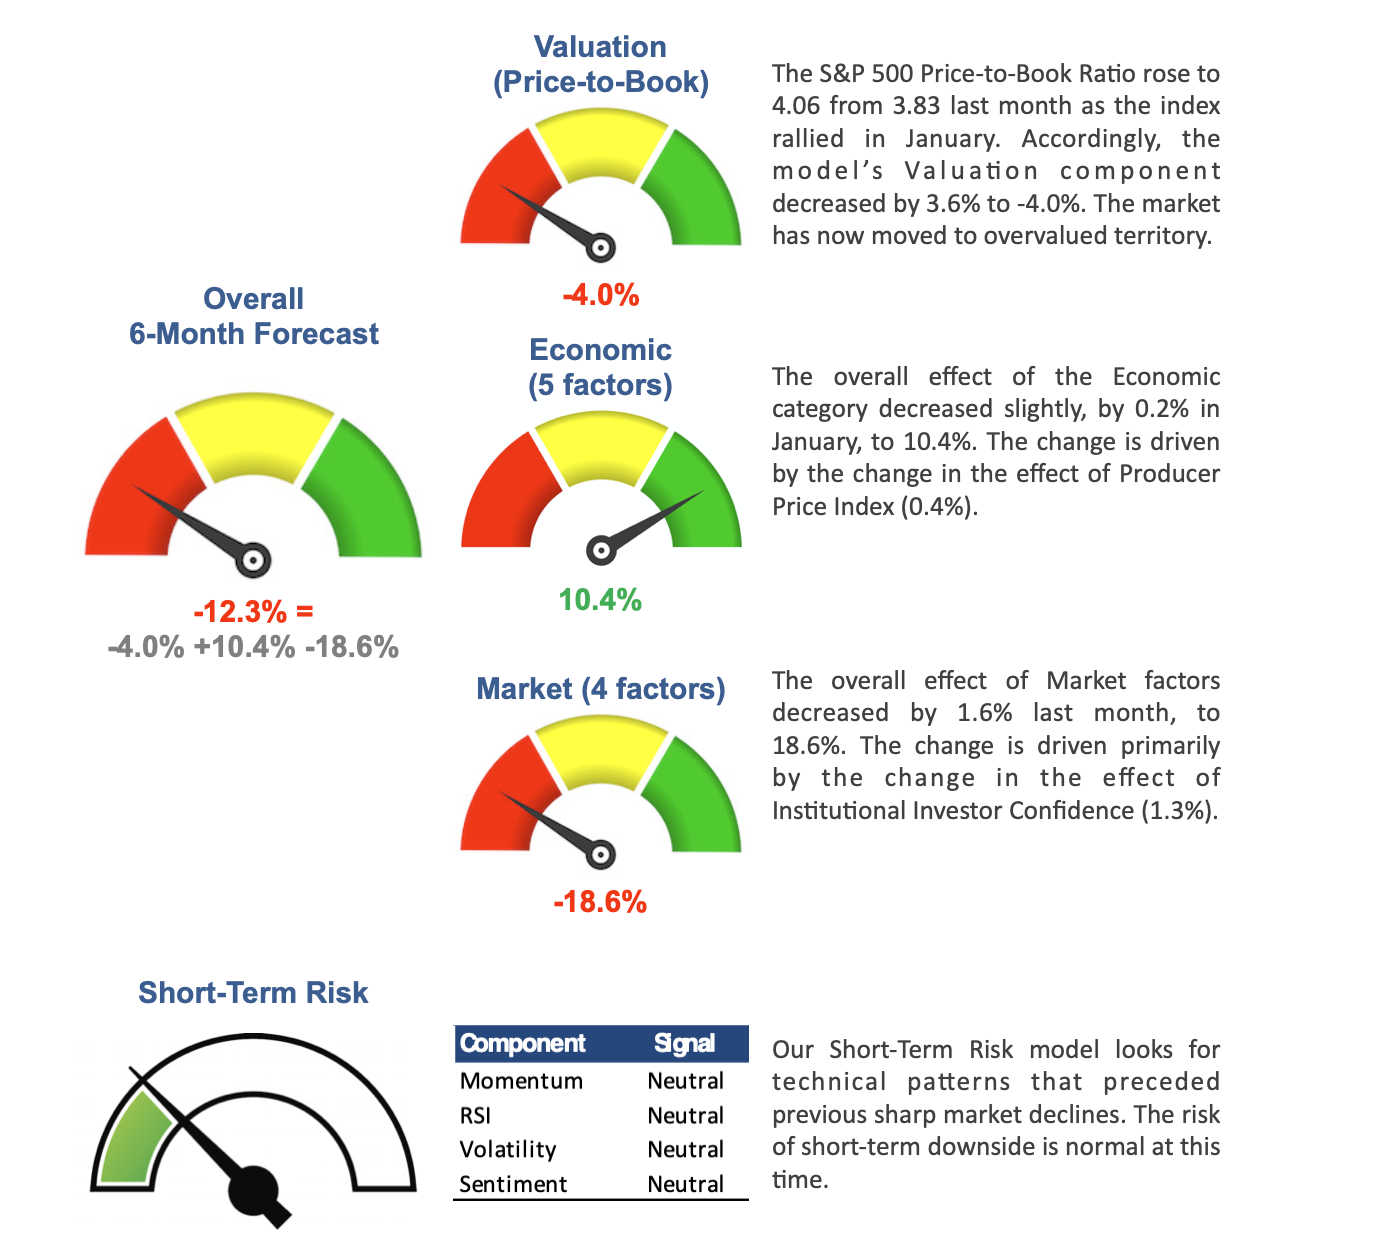
The two models work in tandem as part of our process. The 6-month Equity Model indicates the overall mid-term market direction, while the Short-Term Risk Model helps protect against sharp corrections. The Equity Model’s 6-month forecast remains below the -5% threshold which dictates defensive positioning in our investment strategies.
Economic Update
In this section, I always provide additional analysis focusing on the economy, which is qualitative in nature and “adds color” to our model results described in the previous section. The latest data shows that consumer spending is now falling as well as manufacturing, which increases the chance of a recession.
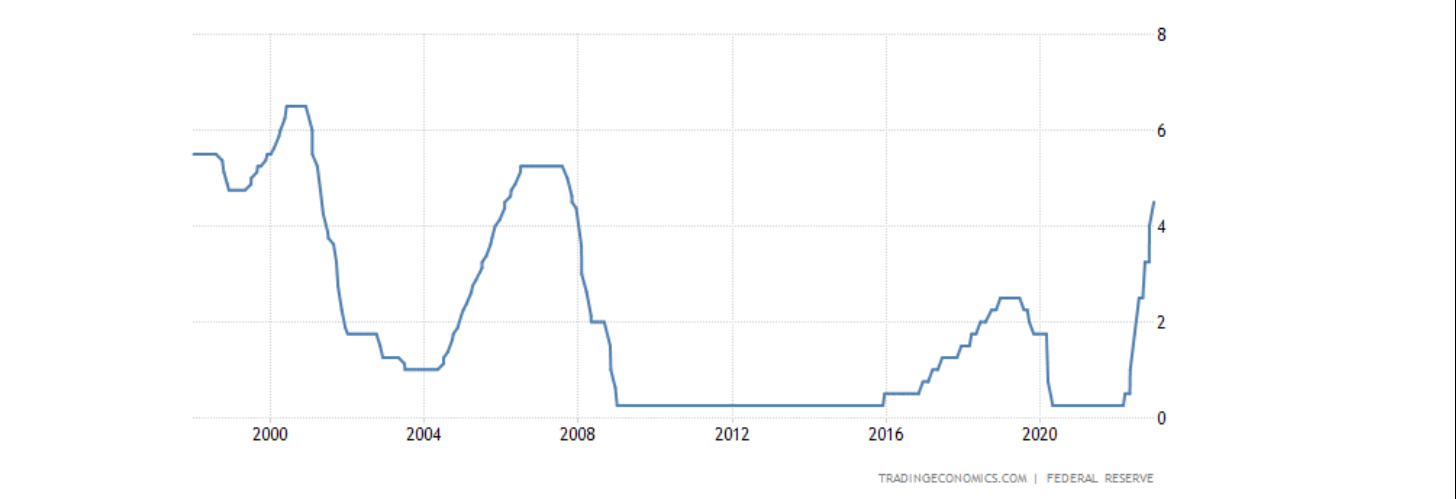
The Fed and Yields
The Fed took decisive action to combat runaway inflation. The Fed Funds rate was raised from 0.25% to 4.75% in eight rate hikes, pushing borrowing costs to the highest since 2007. One more 0.25% hike is expected by bond traders in March, according to the CME Fed Watch tool.
Fed Funds Rate, 25 Years
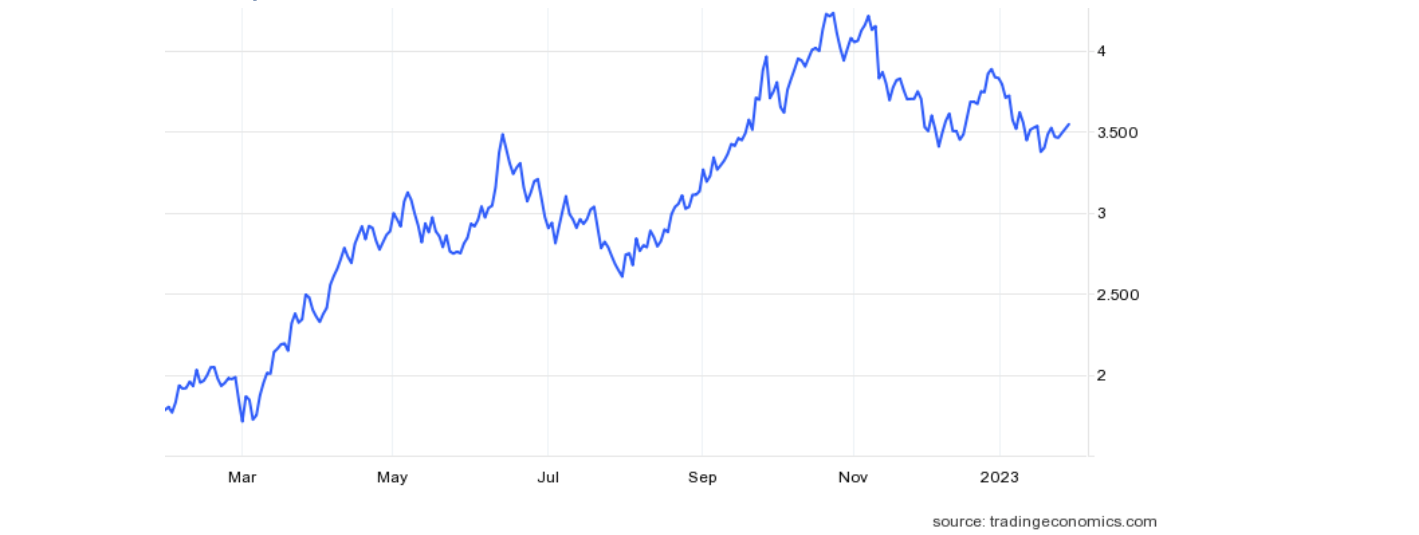
Longer-term Treasury yields rose but lagged the upward pace of short-term yields. The benchmark 10-year yield fluctuated between 3.5% and 4%, currently around 3.6%, which puts the inversion of the yield curve above 1%, the highest in decades. An inverted yield curve is the single best herald of a recession.
10-Year Treasury Yield, 1 Year
The Effect on The Economy
Higher rates increase borrowing costs, which puts pressure of the economy. While GDP grew at an annualized 2.9% in Q4-2022, a big part of it was attributed to inventory growth, and the economy clearly weakened since December.
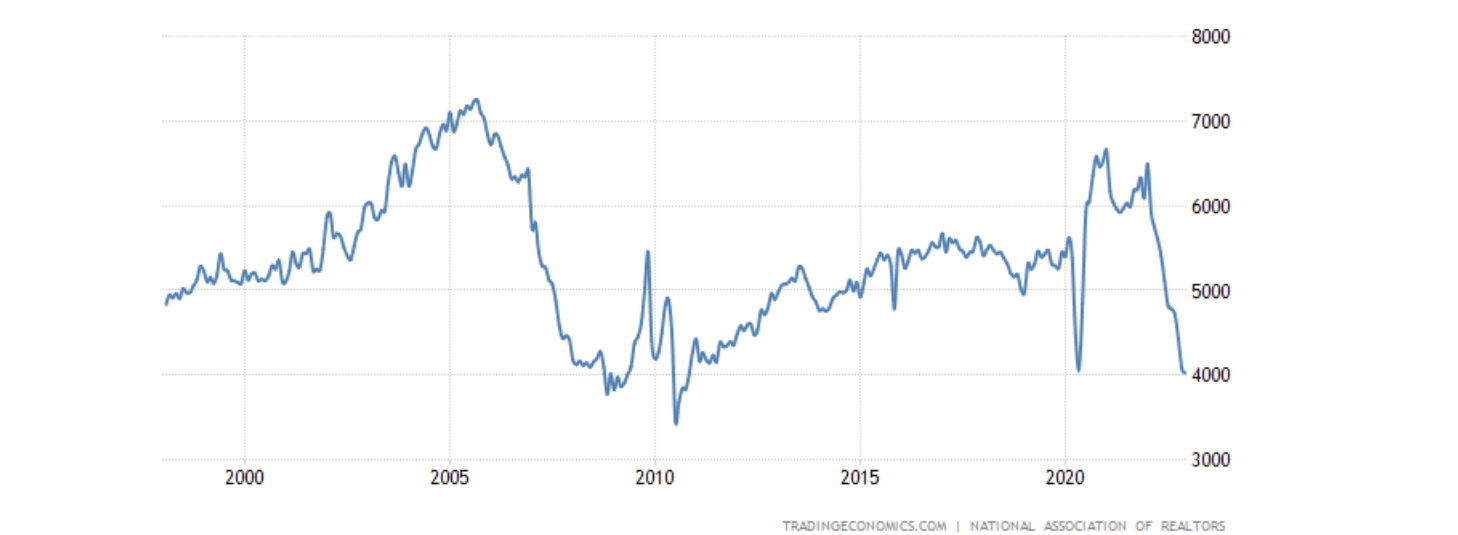
Housing was hit the hardest by rising rates. Existing home sales tumbled in 2022 and continued to fall in January, to an annual rate of 4 million, the lowest since December of 2011 (see chart). The Dec-Jan retreat in mortgage rates did not revive home sales, and if the 10-year yield rises toward 3.8% it would stifle the market further. Recall that a similar fall in home sales and prices preceded the financial crisis of 2008.
Existing Home Sales, 25 Years
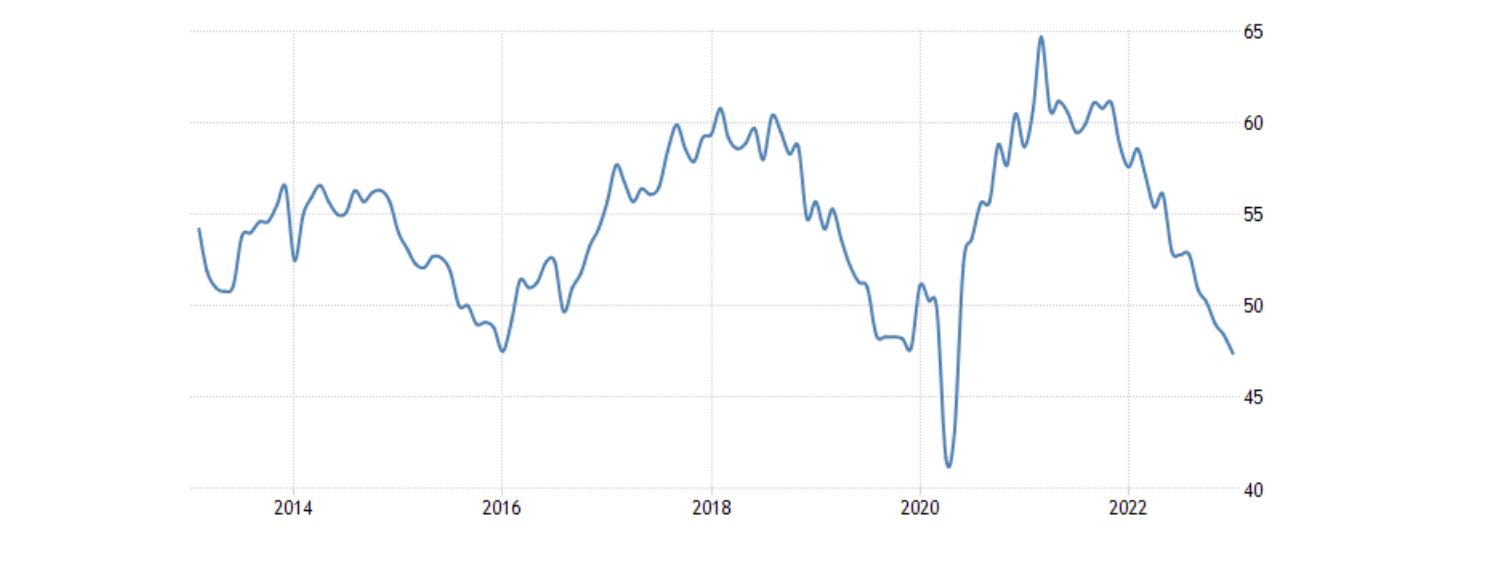
Manufacturing also weakened throughout 2022. The ISM Manufacturing PMI fell to 47.4 in January, pointing to the third consecutive month of contraction in factory activity (values below 50), and its lowest level since the midst of the COVID pandemic in 2020:
ISM Manufacturing PMI, 10 Years
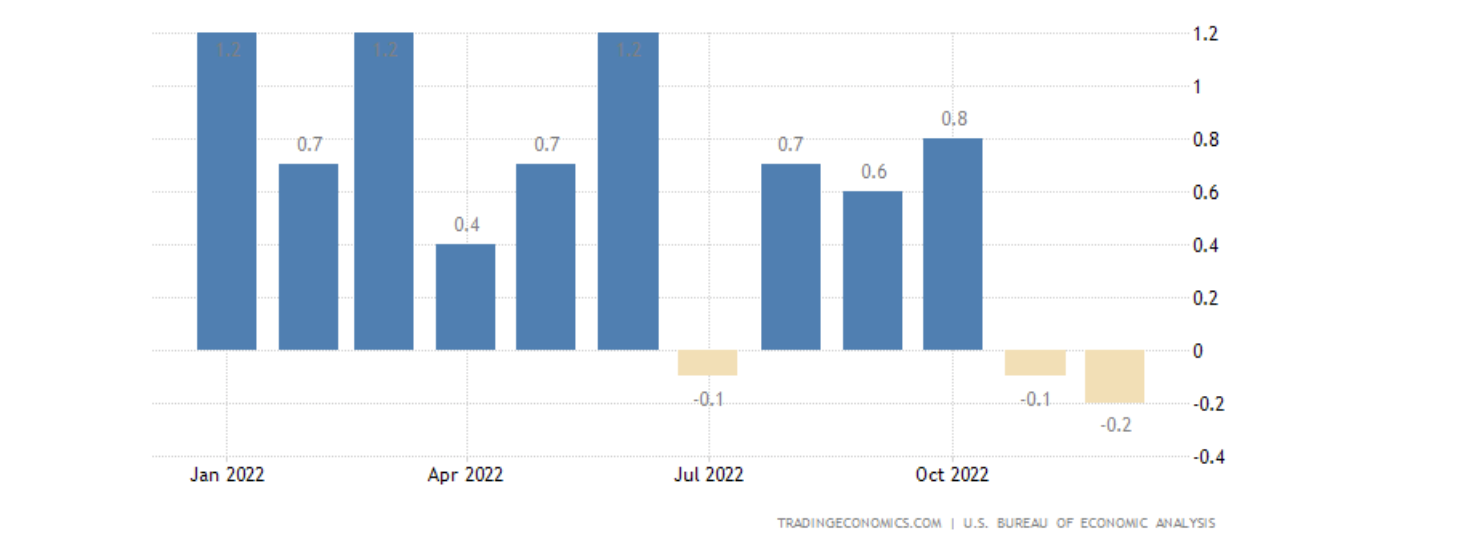
Consumer spending stayed strong until October, but also gave in to pressure from higher interest rates at the end of 2022 (see chart). As consumer spending constitutes 70% of the US economy, it indicates that a broader economic contraction is beginning.
US Personal Spending, MoM Growth, 1 Year
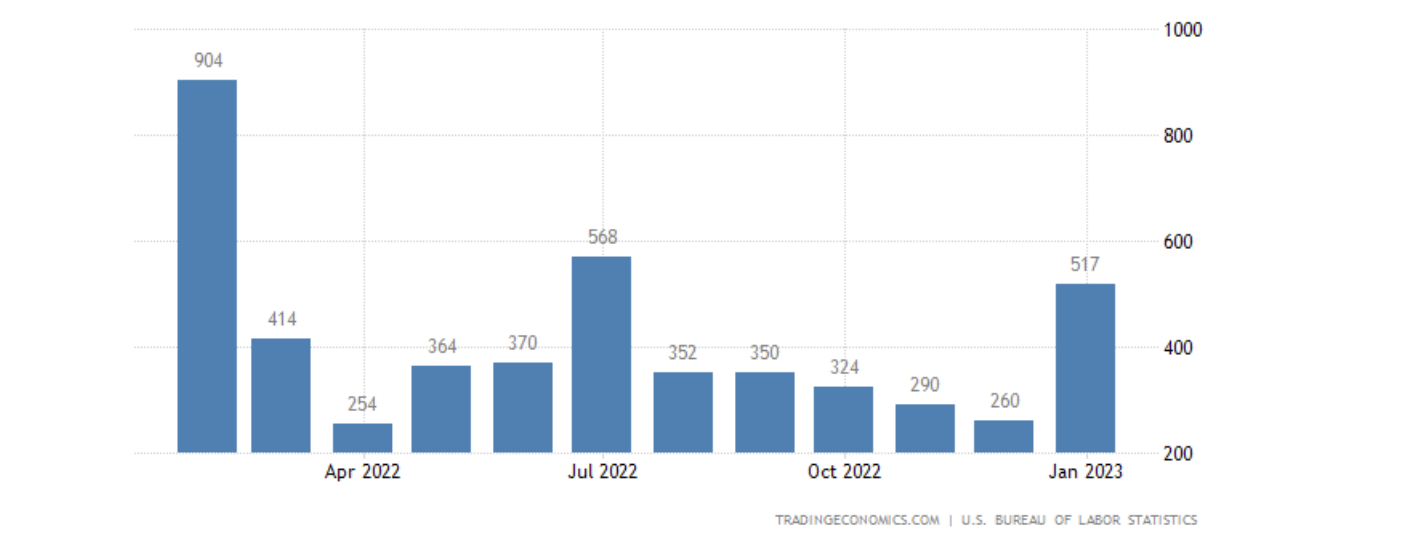
Despite some cracks, the labor market continues to stay strong by most measures. Although there have been stories of layoffs, particularly in technology, most statistics remain healthy. Private non-farm payrolls unexpectedly jumped by 517K in January (see chart), way above market forecasts of 185K. The unemployment rate inched lower to 3.4%, its lowest level since 1969. The only negative here is a private statistic Challenger Job Cuts, according to which employers announced 102.9K job cuts in January, the most since September of 2020.
US Non-Farm Payrolls, 1 Year
To summarize, economic weakness is spreading, the yield curve inversion is extreme, and the Fed continues to tighten. All this increases the chance of a recession, at a time when optimistic stock investors drove the market higher in January.
About Model Capital Management LLC
Model Capital Management LLC (“MCM”) is an independent SEC-registered investment adviser, and is based in Waltham, Massachusetts. Utilizing its fundamental, forward-looking approach to asset allocation, MCM provides asset management services aimed to help other advisors implement its dynamic investment strategies designed to reduce significant downside risk. MCM is available to advisors on SMArtX Advisory, Axos Advisor Services, and Envestnet platforms, but is not affiliated with those firms.
Notices and Disclosures
- This research document and all of the information contained in it (“MCM Research”) is the property of MCM. The Information set out in this communication is subject to copyright and may not be reproduced or disseminated, in whole or in part, without the express written permission of MCM. The trademarks and service marks contained in this document are the property of their respective owners. Third-party data providers make no warranties or representations relating to the accuracy, completeness, or timeliness of the data they provide and shall not have liability for any damages relating to such data.
- MCM does not provide individually tailored investment advice. MCM Research has been prepared without regard to the circumstances and objectives of those who receive it. MCM recommends that investors independently evaluate particular investments and strategies and encourages investors to seek the advice of an investment adviser. The appropriateness of an investment or strategy will depend on an investor’s circumstances and objectives. The securities, instruments, or strategies discussed in MCM Research may not be suitable for all investors, and certain investors may not be eligible to purchase or participate in some or all of them. The value of and income from your investments may vary because of changes in securities/instruments prices, market indexes, or other factors. Past performance is not a guarantee of future performance, and not necessarily a guide to future performance. Estimates of future performance are based on assumptions that may not be realized.
- MCM Research is not an offer to buy or sell or the solicitation of an offer to buy or sell any security/instrument or to participate in any particular trading strategy. MCM does not analyze, follow, research or recommend individual companies or their securities. Employees of MCM may have investments in securities/instruments or derivatives of securities/instruments based on broad market indices included in MCM Research. MCM’s Form ADV, Part 2A (Brochure) contains further details pertaining to employee training.
- MCM is not acting as a municipal advisor and the opinions or views contained in MCM Research are not intended to be, and do not constitute, advice within the meaning of Section 975 of the Dodd-Frank Wall Street Reform and Consumer Protection Act.
- MCM Research is based on public information. MCM makes every effort to use reliable, comprehensive information, but we make no representation that it is accurate or complete. Opinions or information are subject to change with respect to MCM Research.
- MCM DOES NOT MAKE ANY EXPRESS OR IMPLIED WARRANTIES OR REPRESENTATIONS WITH RESPECT TO THIS MCM RESEARCH (OR THE RESULTS TO BE OBTAINED BY THE USE THEREOF), AND TO THE MAXIMUM EXTENT PERMITTED BY LAW, MCM HEREBY EXPRESSLY DISCLAIMS ALL WARRANTIES (INCLUDING, WITHOUT LIMITATION, ANY IMPLIED WARRANTIES OF ORIGINALITY, ACCURACY, TIMELINESS, NON-INFRINGEMENT, COMPLETENESS, MERCHANTABILITY AND/OR FITNESS FOR A PARTICULAR PURPOSE).
- “Model Return Forecast” for 6-month S&P 500 return is MCM’s measure of attractiveness of the U.S. equity market obtained by applying MCM’s proprietary statistical algorithm and historical data, but is not promissory, and, by itself, does not constitute an investment recommendation. Model Return Forecasts were calculated and applied by MCM to its research and investment process in real time beginning from 2012. For periods prior to Jan 2012, the results are “back-tested,” i.e., obtained by retroactively applying MCM’s algorithm and historical data available in Jan 2012 or thereafter. Back-tested performance, if any, is presented gross of any advisory fees and trading expenses. Index returns referenced in MCM Research, if any, are gross of any advisory fees, fund management fees, and trading expenses. Fund or ETF returns referenced, if any, are gross of advisory fees and trading expenses. Returns will be reduced by fees and expenses incurred.
