
At the time of our last update, the S&P 500 had been sitting right on its 200-day moving average, after briefly moving below it. Last week, the market index rallied off of the moving average. Every S&P sector gained last week, with a few of the market’s weaker sectors receiving larger bounces. As it stands today, about 55% of S&P 500 stocks are above their respective 200-day moving average.
Sector leadership is fairly diversified right now. Information Technology and Consumer Staples hold the top two spots of the 11 S&P 500 sectors, ranked on a risk adjusted basis, followed by Industrials and Communications. According to Canterbury’s Market State indicators, which measure a security’s risk, only 3 S&P 500 sectors are currently in a high risk “bearish” Market State. Those sectors are Utilities, Real Estate, and Financials. All other sectors are either in a low risk “bullish” or “transitional” Market State.
Technology is Leading
One positive sign for the markets is when technology stocks are outperforming on a relative basis. Think about it like this: technology stocks are often associated with “risk.” Technology showing leadership over the broad market is a sign that investors may be willing to take on more perceived risk. Technology stocks most often lead during bull markets, while more perceived “defensive” market sectors like Utilities and Healthcare lead during bear markets. Right now, technology heavy sectors are ranked high on a risk-adjusted basis.
The chart below shows the Nasdaq 100 index, which is mostly composed of technology-related stocks. Not only is the index above its 200-day moving average, but it appears to have put in a slightly higher high and higher low. The lower half of the chart shows the index’s relative strength to the S&P 500. When the slope of the relative strength line is positive, the Nasdaq is outperforming relative to the S&P 500. As you can see, the Nasdaq’s relative strength has been increasing, with a steep slope, throughout most of the last 3 months.
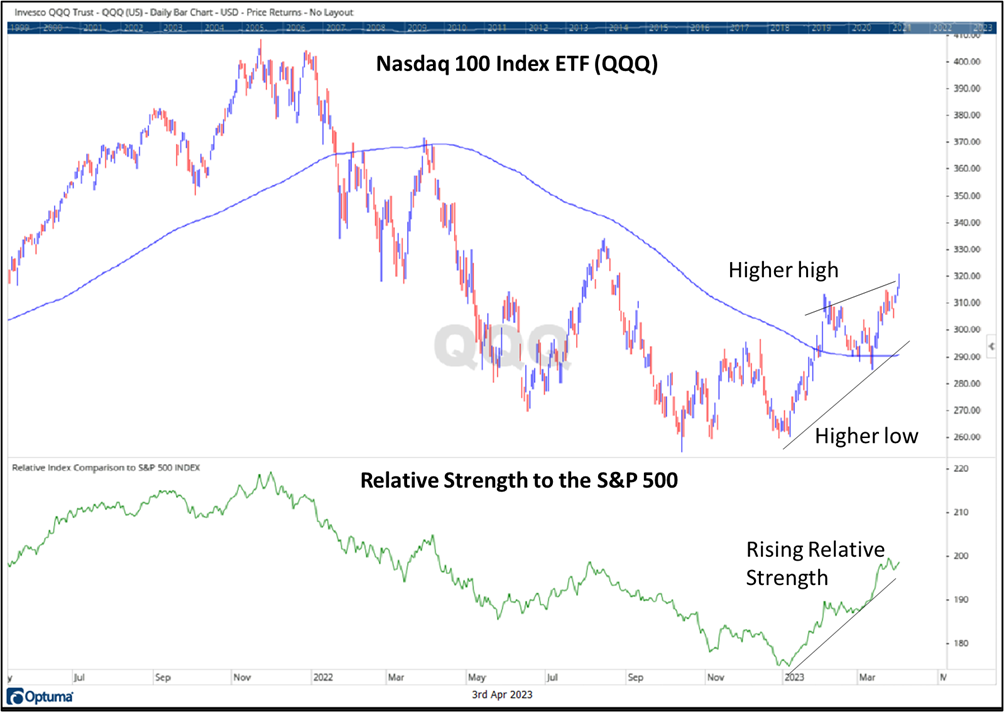
Source: Canterbury Investment Management. Chart created using Optuma Technical Analysis Software
We should note that looking at the market’s largest individual sector, Information Technology, it is a little overextended (overbought) right now– it may have come a little too far, too fast. Additionally, the sector has now matched its August 2022 high point, which will likely behave as a point of resistance. In other words, this would be a normal point to see a pullback. It might need to work off some overhead supply in order to move higher.
Bottom Line
Technology stocks are leading right now. That is important for the overall strength of the markets, given the S&P 500’s structure. Technology-related stocks account for close to 40% of the index’s market capitalization. In other words, the market will go as technology goes. Last year, a bear market, was fueled by a decline in technology stocks.
As has been the trend, we continue to see leadership across global markets. Following the Credit Suisse fiasco, many European indexes, like the Euro Stoxx 50 have recovered and moved higher. On the other hand, emerging market stocks are lagging.
The market is not in a state of “all systems go” right now. There are quite a few weak spots in the market, as lowlighted by financials and real estate. Small cap stocks also continue to underperform, due to their large weighting towards financials. For that reason, is important for the Canterbury Portfolio Thermostat to continue to hold some defensive, inverse position in the weaker areas, like emerging markets, small caps, and real estate, to help mitigate large fluctuations. That being said, the Portfolio Thermostat has also rotated to technology-related securities and holds stronger international indexes that are leading global equity markets on a risk adjusted basis.
For more news, information, and analysis, visit the ETF Strategist Channel.
