
SUMMARY
Transitions we are anticipating for 2023:
- From inflation to recession
- From the pandemic to geopolitics
- From a Bear Market to a potential Bull, once depth of recession is known
Summary 2023 Outlook: A Market in Transition
Market Bottoming is a process, not an event; messy first half of ’23, stronger finish, in our view
RiverFront is proud to release our 2023 Outlook, entitled ‘A Market in Transition’. Our Outlook is a visual chart pack designed to walk investors through our investment views and predictions for the upcoming year. In today’s Weekly View, we created a concise synopsis of the Outlook’s conclusions, along with a few selected visuals that encapsulate a number of key takeaways.
2023: A YEAR OF IMPORTANT MARKET TRANSITIONS
In our view, 2023 will be a year of important ‘transitions’. We believe the first transition will be away from a bear market to a potential bull. History suggests attractive forward returns for stocks after the type of drawdowns we witnessed in 2022, but the timing of the market bottom is unclear and the process will be bumpy, in our view. Longer-term, returns for balanced stock and bond portfolios look attractive to us again, with valuations more reasonable and bond yields above long-term inflation expectations.
We believe the next two major transitions involve an evolution of investors’ concerns: away from inflation and towards recession, as well as away from pandemic-related disruptions towards geopolitical ones. In this world, the US remains a more attractive investment destination than international in our view. A Fed ‘pivot’ towards less restrictive policy is likely later in the year, with the magnitude of earnings declines determining whether the market has already seen its ultimate lows or not.
The last major transition we see for ’23 involves the end of ‘growth’ stock dominance and an increased focus on consistent cash flow, dividend, and coupon generators – what RiverFront calls the ‘P.A.T.T.Y.’ (Pay Attention to the Yield) theme. Under these circumstances, we see modest upside for stocks and bonds in our base case scenario, with preferences for consistent cash flow generators, cyclicals, smaller-cap companies, and traditional ‘value’ plays like energy and financials.
WE BELIEVE STOCKS AND BONDS HAVE MODEST UPSIDE FOR 2022
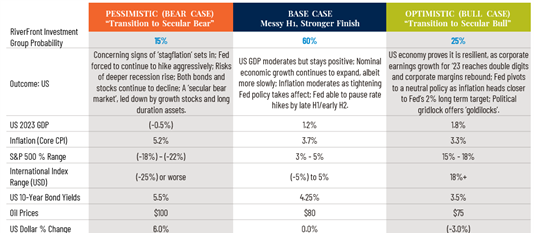
The table depicts RiverFront’s predictions for 2023 using three scenarios (Pessimistic (Bear), Base, and Optimistic (Bull)). Our assessment of each scenario’s probability (“RiverFront Investment Group Probability”) is also shown. The assessment is based on RiverFront’s Investment team’s views and opinions as of 12.13.2022. Each case is hypothetical and is not based on actual investor experience. These views are subject to change and are not intended as investment recommendations. There is no representation that an investor will or is likely to achieve positive returns, avoid losses or experience returns as discussed for various market classes. See end of document for definitions.
Worst Market for Balanced Portfolios on Record: Brighter Days Ahead, in Our View
Thus far, 2022 is the worst year on record (going back to 1942) for a balanced portfolio of 60% Large Cap US stocks and 40% 10-year US treasury bonds.
Stocks dropped around -25% peak-to-trough by the end of Q3, and bonds more than -23%, before both stocks and bonds rebounded in Q4.
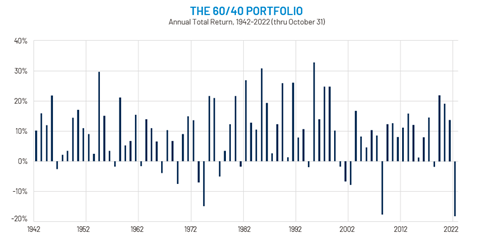
Source: Refinitiv Datastream, RiverFront; data monthly as of 10.31.2022. Chart shown for illustrative purposes only. See Definitions & Disclosures section for index definitions.
History Suggests Positive Returns Likely After > (-25%) Drawdowns
History suggests that big drawdowns often lead to positive results in the next year, and especially in the longer-term.
While our base case in 2023 is for a transition year with muted returns, this bodes well for 3–5 year returns, in our view.
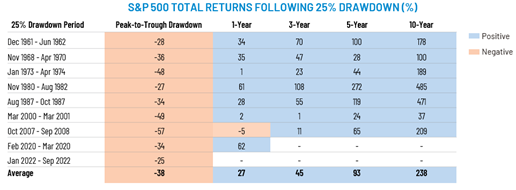
Source: Goldman Sachs Asset Management, Strategic Advisory Solutions, 10.07.22, Chart of the Week: Don’t Dread the Drawdown. Chart shown for illustrative purposes only. Past results are no guarantee of future returns.
Anatomy of A Market Bottom: Typically, False Starts
During bear markets, stocks often experience short, sharp rallies that eventually fail. We may be in another one as we speak. Extreme market volatility in both directions compounds the difficulty of making tactical risk management decisions. Current volatility reminds us of 2000-03 or 2008-09, when a number of double-digit false dawn rallies emerged (green shaded areas), only to eventually fail, with markets making new lows before bottoming for good.

Source: Refinitiv Datastream. (Chart Left) data as of 01.01.04. (Chart Right) data as of 01.01.10. Chart shown for illustrative purposes only. The 200-day moving average is a popular technical indicator that investors use to analyze price trends. It is simply a security’s average closing price over the last 200 days. Past results are no guarantee of future results.
PORTFOLIO VIEWS AND POSITIONING TO START THE YEAR
Modest Upside for Stocks and Bonds in Base Case Scenario
- Stocks in a bottoming process, magnitude of earnings decline will determine if there is a lower low; Bonds are increasingly attractive to us, as yields are above long-term inflation expectations and real yields (TIPS) are positive
- Stocks no longer expensive: Earnings and margins vulnerable but we see only mild erosion
- 1970’s/80’s Playbook: Focus on consistent cash flow and dividends/coupons
- ‘Silver Lining’: Longer-term returns for balanced portfolios now appear attractive to us again
Selection: Neutral Fixed Income & Cash; Prefer US stocks to International
- US Stocks: We favor the US over international, given geographic and demographic advantages, stronger margins
- We favor consistent cash flow generators, cyclicals, small-cap and traditional ‘value’ plays like energy and financials
- International Equities: Tactically underweight, with potential opportunities in 2023
- Developed Markets: Underweight – Europe and Japan historically cheap but fundamentally challenged; focus on value
- Emerging Markets: Underweight – Still skeptical on China economy
Fixed Income: Neutral – interest rate volatility remains, but we believe yields now attractive and should act as a recession hedge
For more news, information, and analysis, visit the ETF Strategist Channel.
Risk Discussion: All investments in securities, including the strategies discussed above, include a risk of loss of principal (invested amount) and any profits that have not been realized. Markets fluctuate substantially over time, and have experienced increased volatility in recent years due to global and domestic economic events. Performance of any investment is not guaranteed. In a rising interest rate environment, the value of fixed-income securities generally declines. Diversification does not guarantee a profit or protect against a loss. Investments in international and emerging markets securities include exposure to risks such as currency fluctuations, foreign taxes and regulations, and the potential for illiquid markets and political instability. Please see the end of this publication for more disclosures.
Important Disclosure Information:
The comments above refer generally to financial markets and not RiverFront portfolios or any related performance. Opinions expressed are current as of the date shown and are subject to change. Past performance is not indicative of future results and diversification does not ensure a profit or protect against loss. All investments carry some level of risk, including loss of principal. An investment cannot be made directly in an index.
Information or data shown or used in this material was received from sources believed to be reliable, but accuracy is not guaranteed.
This report does not provide recipients with information or advice that is sufficient on which to base an investment decision. This report does not take into account the specific investment objectives, financial situation or need of any particular client and may not be suitable for all types of investors. Recipients should consider the contents of this report as a single factor in making an investment decision. Additional fundamental and other analyses would be required to make an investment decision about any individual security identified in this report.
Chartered Financial Analyst is a professional designation given by the CFA Institute (formerly AIMR) that measures the competence and integrity of financial analysts. Candidates are required to pass three levels of exams covering areas such as accounting, economics, ethics, money management and security analysis. Four years of investment/financial career experience are required before one can become a CFA charterholder. Enrollees in the program must hold a bachelor’s degree.
All charts shown for illustrative purposes only. Technical analysis is based on the study of historical price movements and past trend patterns. There are no assurances that movements or trends can or will be duplicated in the future.
Stocks represent partial ownership of a corporation. If the corporation does well, its value increases, and investors share in the appreciation. However, if it goes bankrupt, or performs poorly, investors can lose their entire initial investment (i.e., the stock price can go to zero). Bonds represent a loan made by an investor to a corporation or government. As such, the investor gets a guaranteed interest rate for a specific period of time and expects to get their original investment back at the end of that time period, along with the interest earned. Investment risk is repayment of the principal (amount invested). In the event of a bankruptcy or other corporate disruption, bonds are senior to stocks. Investors should be aware of these differences prior to investing.
In general, the bond market is volatile, and fixed income securities carry interest rate risk. (As interest rates rise, bond prices usually fall, and vice versa). This effect is usually more pronounced for longer-term securities). Fixed income securities also carry inflation risk, liquidity risk, call risk and credit and default risks for both issuers and counterparties. Lower-quality fixed income securities involve greater risk of default or price changes due to potential changes in the credit quality of the issuer. Foreign investments involve greater risks than U.S. investments, and can decline significantly in response to adverse issuer, political, regulatory, market, and economic risks. Any fixed-income security sold or redeemed prior to maturity may be subject to loss.
Index Definitions:
Standard & Poor’s (S&P) 500 Index (US Large Cap) measures the performance of 500 large cap stocks, which together represent about 80% of the total US equities market.
Bloomberg Capital US Treasury Index (Treasury Bonds) measures the performance of the US Treasury bond market.
Gross Domestic Product (GDP) is the monetary value of all finished goods and services made within a country during a specific period. GDP provides an economic snapshot of a country, used to estimate the size of an economy and growth rate.
The Consumer Price Index (CPI) is a measure that examines the weighted average of prices of a basket of consumer goods and services, such as transportation, food, and medical care. It is calculated by taking price changes for each item in the predetermined basket of goods and averaging them. Changes in the CPI are used to assess price changes associated with the cost of living. The CPI is one of the most frequently used statistics for identifying periods of inflation or deflation.
Principal Risks:
In a rising interest rate environment, the value of fixed income securities generally declines.
Small-, mid- and micro-cap companies may be hindered as a result of limited resources or less diverse products or services and have therefore historically been more volatile than the stocks of larger, more established companies.
Investing in foreign companies poses additional risks since political and economic events unique to a country or region may affect those markets and their issuers. In addition to such general international risks, the portfolio may also be exposed to currency fluctuation risks and emerging markets risks as described further below.
Changes in the value of foreign currencies compared to the US dollar may affect (positively or negatively) the value of the portfolio’s investments. Such currency movements may occur separately from, and/or in response to, events that do not otherwise affect the value of the security in the issuer’s home country. Also, the value of the portfolio may be influenced by currency exchange control regulations. The currencies of emerging market countries may experience significant declines against the US dollar, and devaluation may occur subsequent to investments in these currencies by the portfolio.
Foreign investments, especially investments in emerging markets, can be riskier and more volatile than investments in the US and are considered speculative and subject to heightened risks in addition to the general risks of investing in non-US securities. Also, inflation and rapid fluctuations in inflation rates have had, and may continue to have, negative effects on the economies and securities markets of certain emerging market countries.
Definitions:
The 200-day moving average is a popular technical indicator which investors use to analyze price trends. It is simply a security’s average closing price over the last 200 days.
H2 = Second half of calendar year
Stagflation is the persistent high inflation combined with high unemployment and stagnant demand in a country’s economy.
Treasury Inflation Protected Securities (TIPS) are Treasury securities that are indexed to inflation in an effort to protect investors from the negative effects of inflation. The principal value of TIPS is periodically adjusted according to the rate of inflation as measured by the Consumer Price Index (CPI), while the interest rate remains fixed. TIPS will decline in value when real interest rates rise. Portfolios that invest in TIPS are not guaranteed and will fluctuate in value.
RiverFront Investment Group, LLC (“RiverFront”), is a registered investment adviser with the Securities and Exchange Commission. Registration as an investment adviser does not imply any level of skill or expertise. Any discussion of specific securities is provided for informational purposes only and should not be deemed as investment advice or a recommendation to buy or sell any individual security mentioned. RiverFront is affiliated with Robert W. Baird & Co. Incorporated (“Baird”), member FINRA/SIPC, from its minority ownership interest in RiverFront. RiverFront is owned primarily by its employees through RiverFront Investment Holding Group, LLC, the holding company for RiverFront. Baird Financial Corporation (BFC) is a minority owner of RiverFront Investment Holding Group, LLC and therefore an indirect owner of RiverFront. BFC is the parent company of Robert W. Baird & Co. Incorporated, a registered broker/dealer and investment adviser.
To review other risks and more information about RiverFront, please visit the website at www.riverfrontig.com and the Form ADV, Part 2A. Copyright ©2022 RiverFront Investment Group. All Rights Reserved. ID 2646016
