
By Gary Stringer, Kim Escue and Chad Keller, Stringer Asset Management
We continue to think that the global economy is stabilizing at a lower, but more sustainable growth rate than we saw last year or even during the first quarter of this year for the U.S. economy. This slower economic growth leaves markets more susceptible to shocks and we think it is important to emphasize areas of consistency and stability rather than areas that are more economically sensitive.
This sustainable economic growth will likely be led by a resilient U.S. economy and steadying economic growth in China with the support of government stimulus. Though fears of a global recession have receded since last December and domestic equity markets recently made new highs before pulling back, we think that the initial estimate of U.S. GDP at 3.2% will prove to be temporary. Note that much of the impressive Q1 2019 U.S. GDP growth was led by inventory rebuilding. This kind of growth tends to be transitory since companies cannot rebuild inventories forever. We are already seeing signs in recent data that U.S. economic growth is coming back down towards a more sustainable level, which we estimate to be in the 2.0% – 2.5% range (exhibit 1).

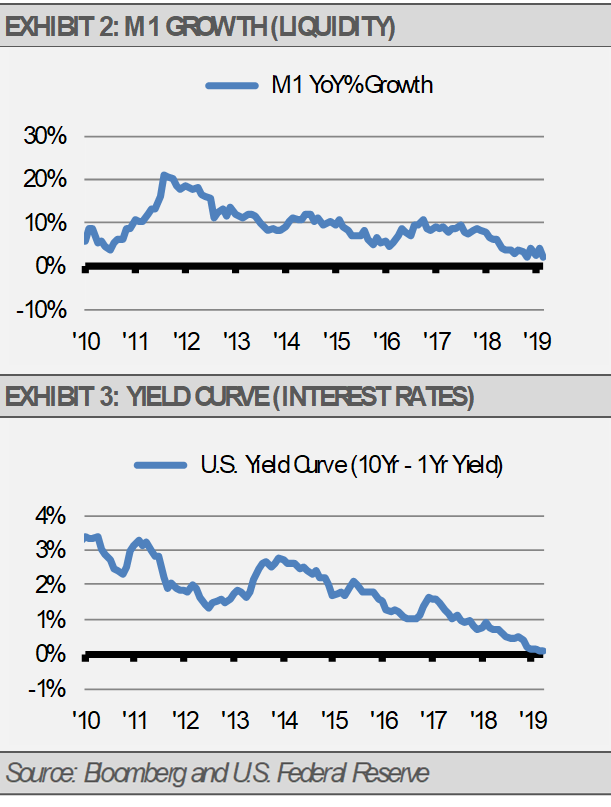
As long as the U.S. Federal Reserve (Fed) acknowledges that monetary conditions, as measured by liquidity and interest rates, have tightened significantly over the last year and their policy decisions should reflect that trend, we see a very low risk of recession in the U.S. (exhibits 2 & 3).
We think that the U.S. economy will continue grow, leading to higher corporate revenues, earnings, and supporting higher equity prices (exhibit 4). This slow but stable growth leads to an estimate of 10-year Treasury yields in the 2.25% – 2.75% range based on historical relationships between U.S. economic growth as well as the relationship between U.S. Treasury yields and yields in foreign markets, especially Germany and Japan.

As a result, our Strategies continue to be focused on defensive and stable U.S. sources of revenue and consistent sources of foreign revenue. These areas include U.S. software development companies, consumer discretionary, and health care. Globally, we are finding opportunities in the consumer and health care sectors as well as infrastructure. We think that each of these areas can produce resilient corporate earnings in the face of soft global economic growth.
THE CASH INDICATOR
By the end of April, the Cash Indicator (CI) had declined to near historic lows. These low levels suggest to us that the global financial markets have become too complacent, even though we see little risk of recession in the near-term. Still, when markets are too complacent, they tend to find reasons for panic. Keep in mind, reversion to the mean also applies to volatility and periods of exceptionally low volatility as we saw in April are not sustainable. However, these occasional panics are not due to fundamental risks to the global economy and may provide attractive investment opportunities for long-term investors.

This article was written by Gary Stringer, CIO, Kim Escue, Senior Portfolio Manager, and Chad Keller, COO and CCO at Stringer Asset Management, a participant in the ETF Strategist Channel.
DISCLOSURES
Any forecasts, figures, opinions or investment techniques and strategies explained are Stringer Asset Management, LLC’s as of the date of publication. They are considered to be accurate at the time of writing, but no warranty of accuracy is given and no liability in respect to error or omission is accepted. They are subject to change without reference or notification. The views contained herein are not be taken as an advice or a recommendation to buy or sell any investment and the material should not be relied upon as containing sufficient information to support an investment decision. It should be noted that the value of investments and the income from them may fluctuate in accordance with market conditions and taxation agreements and investors may not get back the full amount invested.
Past performance and yield may not be a reliable guide to future performance. Current performance may be higher or lower than the performance quoted.
The securities identified and described may not represent all of the securities purchased, sold or recommended for client accounts. The reader should not assume that an investment in the securities identified was or will be profitable.
Data is provided by various sources and prepared by Stringer Asset Management, LLC and has not been verified or audited by an independent accountant.
Index Definitions:
S&P 500 Index – This Index is a capitalization-weighted index of 500 stocks. The Index is designed to measure performance of a broad domestic economy through changes in the aggregate market value of 500 stocks representing all major industries.
