
By Gary Stringer, Kim Escue and Chad Keller, Stringer Asset Management
There are a few important spread indicators in the fixed income market that equity investors can monitor for periods of time when they should be cautious. History suggests that U.S. Federal Reserve (Fed) policy mistakes leading to an inverted yield curve either aided in the creation of or directly precipitated almost every U.S. recession and the majority of related large equity market selloffs over the last 100 years. Another useful indicator to monitor is the spread on corporate bonds, which increases as confidence in credit ratings decreases and the cost of debt rises. While these statistics can provide important insight to the possible timing of an economic slowdown, we do not believe they are signaling an impending equity market selloff. Since the Fed began their recent tightening cycle, the yield curve has flattened to some degree, however, credit spreads remain below their long-term averages. This suggests to us that there are more economic gains left in the current cycle, though the potential risks are heightened at this point.
THE YIELD CURVE
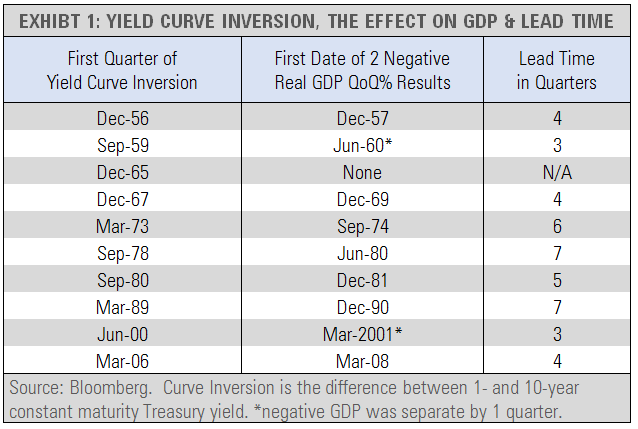
The yield curve is perhaps the best predictive indicator to an economic slowdown. While the Fed influences the short-end of the curve, the long-end is reflective of investors’ expectations for economic conditions in the future. The Fed has begun slowing the economic expansion by increasing rates on the short-end, which lessens liquidity and the profitability of lending. All the while, long-term rates have not increased much since the expectation for future economic growth is not getting better. At this point, the yield curve has flattened and may even become inverted if the Fed makes a policy error by going too far, too fast in rate hiking and misjudging the amount of liquidity in the market. An inverted yield curve is therefore a leading indicator that we can monitor for an impending economic slow-down. While the economic impact of an inverted curve is usually felt several quarters after inversion, we usually start to experience volatility to the downside in equity markets sooner.
![]()
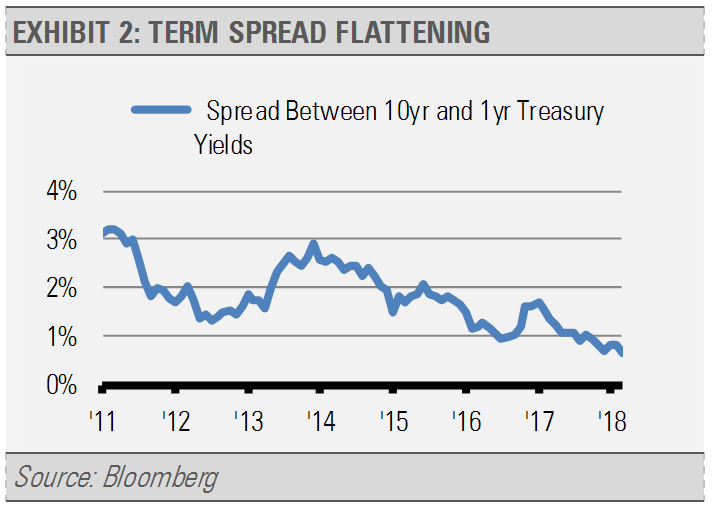
Term spread is a useful way to monitor the Treasury yield curve as it reflects the differences between short-term and long-term rates. While the curve has flattened since the Fed began its tightening cycle, it has not inverted at this point.
CREDIT SPREADS
As a compliment to the yield curve, which reflects the difference in yield attributable to duration, credit spreads measure the difference in yield attributable to credit risk. These spreads are helpful in gauging investors’ expectations for future profitability. For instance, if investors believe the economy will continue growing and companies will be more profitable than they are today, they may not require a company pay them a high interest rate to borrow their money. Conversely, if investors are not as confident about the future economic environment and/or corporate profitability, companies will have to compensate them more for borrowing money. At this point, credit spreads remain below their historical averages, however, high yield spreads are showing a slight uptick. If rates move higher or we start to start to see a slowing trend in GDP, high yield and investment grade credit spreads will likely increase. If those spreads rise, it would signal that the market is losing confidence in their current ratings due to compromised ratios as the cost of debt increases with interest rates or that profitability is expected to slow.
