
By Canterbury Investment Management
Market State 1 (Bullish) – The S&P 500 continues its run in Market State 1, now at 14 consecutive days. Many equity assets experienced a nice little move to end 2019, with the Nasdaq leading the way. Typically, it is a good sign to see the Nasdaq leading the S&P 500.
Watch: Canterbury Weekly Update 1.6.2020
Canterbury Volatility Index: CVI 47: Volatility is low and stable. Last week, we mentioned that volatility had entered extreme low territory (below CVI 45). On a short week last week, the volatility index rose by 2 points. Basically, volatility is still extremely low and still subject to outlier days. On the bright side, low and decreasing volatility is still a bullish characteristic. If an outlier day were to occur, there is no telling when, or what kind of impact the volatility spike would have.
Comment
When analyzing the market, and more specifically the S&P 500, it is always interesting to look at the strength of certain market sectors. The S&P 500 can be broken down to 11 different individual sectors. Those sectors are information technology, financials, industrials, basic materials, utilities, staples, real estate, communications, energy, discretionary, and healthcare. According to S&P Dow Jones Indices, here is the current breakdown for the weight of each sector in the S&P 500:

Source: S&P Dow Jones Indices
Now, if we look at the 2019 performance of the S&P 500 and compare that to the performance of each individual sector, only two sectors actually beat the market for the calendar year 2019: information technology and financials. Financials barely outperformed the market due to a late rally at the end of the year, but technology substantially carried the market. Given a strong year in the tech sector, coupled with technology’s large 23% S&P weighting, the S&P 500 was largely carried by technology. Other sectors performed well for the calendar year, coming off the large drop in 2018, but not nearly to the extent of technology.
Canterbury analyzed sector data going back to 1999 (about the time of the launch of the State Street sector ETFs) and found that 2019 was the first year since 1999 that only 2 S&P sectors outperformed the market. On average, usually about 4-6 sectors beat the S&P 500 each year. To be fair, most sectors were within a relative range of one another, with the exception of energy, but technology substantially outperformed. In addition, about 40% of the technology sector is made up of Apple and Microsoft. Those two stocks had great years coming off of the 2018 drop and carried much of the technology sector.
Healthcare
Healthcare had an interesting year. The S&P healthcare sector is primarily made up of healthcare equipment (32%), healthcare providers (18%), and pharmaceuticals (40%). For most of the year, healthcare had moved in a sideways pattern due to the poor performance of pharmaceuticals. Healthcare equipment, on the other hand, had a nice bullish year. Below is a chart of Medical Devices (ETF: IHI), representing the healthcare equipment sector:
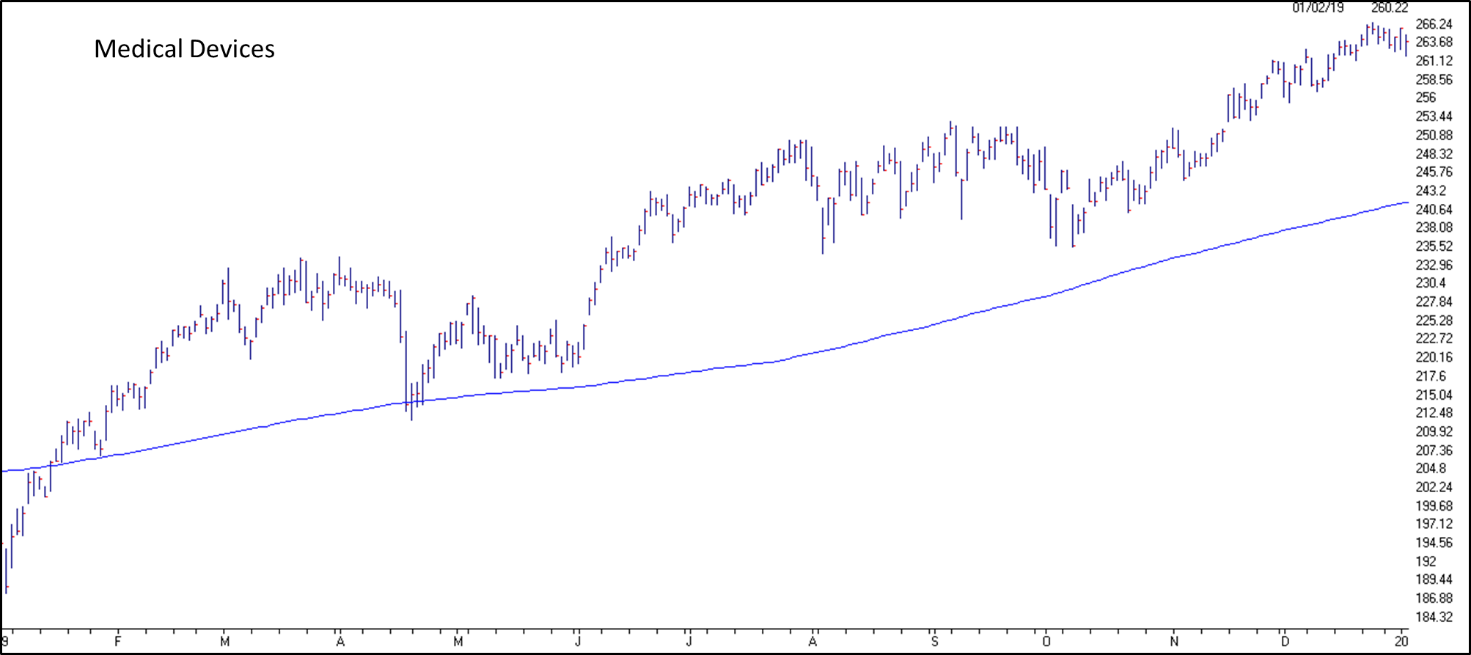
Source: AIQ
Even though healthcare equipment (medical devices) was strong, you can see that overall, the healthcare sector (ETF: XLV) was moving sideways until late in the year:
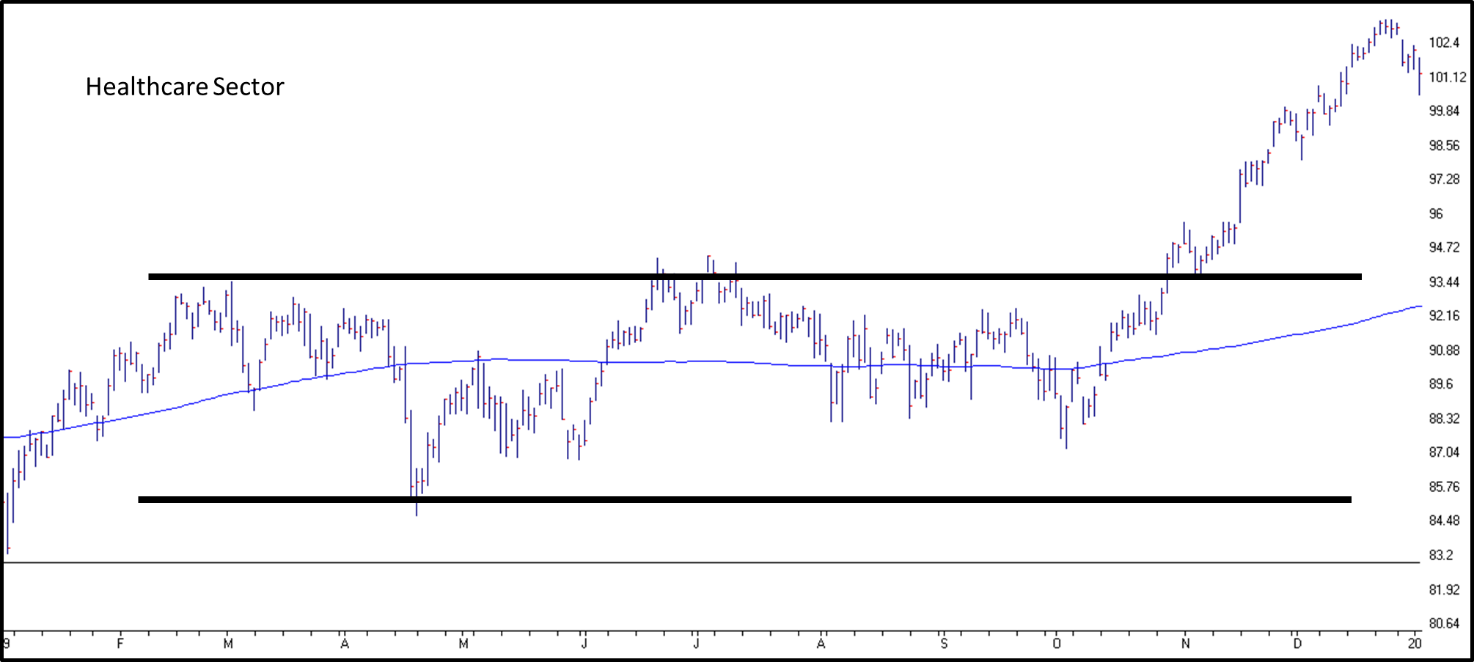
Source: AIQ
This was mainly due to poor performance of pharmaceuticals (ETF: XPH), followed by an end of the year rally:
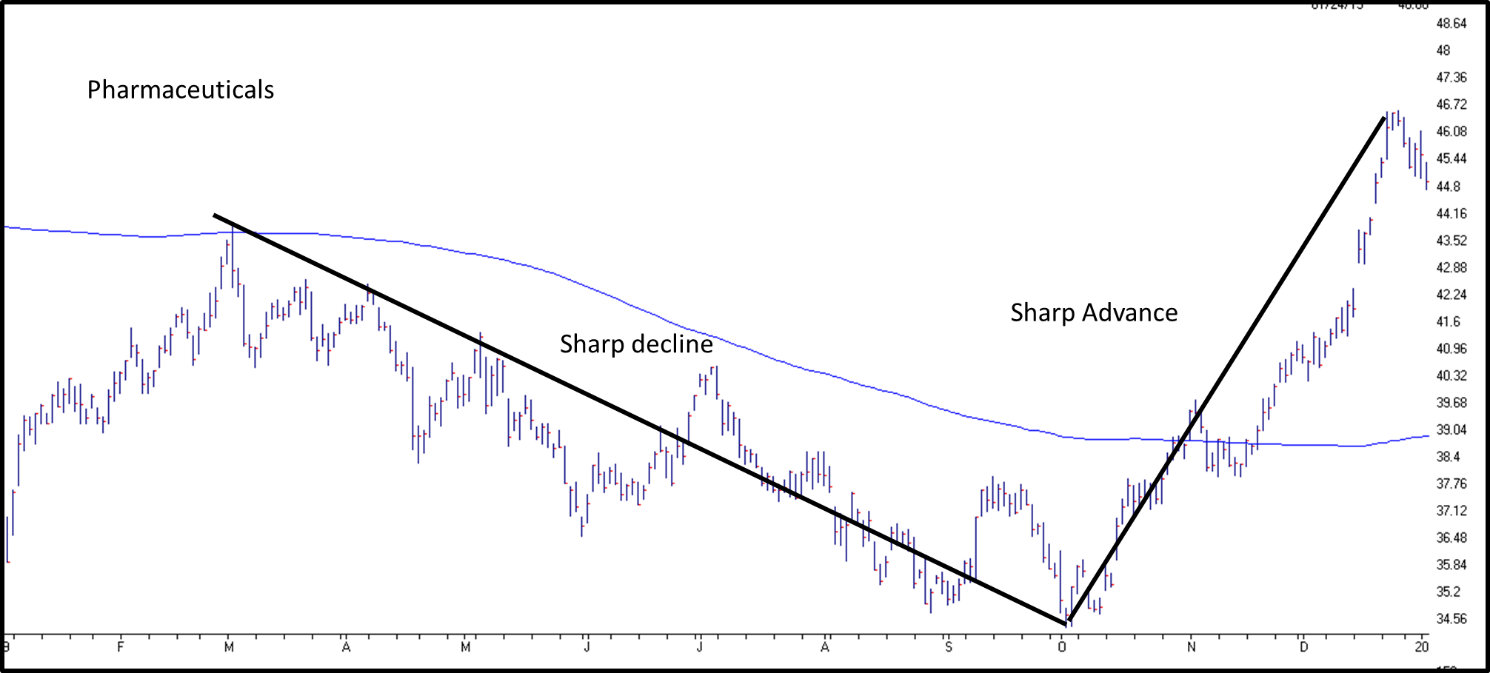
Source: AIQ
Portfolio Efficiency
The Canterbury Portfolio Thermostat does not aim to compete against any individual index or blended benchmark. We know that portfolio efficiency is a moving target, and all asset classes will go in and out of favor. The Portfolio Thermostat is an Adaptive Portfolio Strategy designed to navigate various markets and create an efficient portfolio for today’s environment- Bull or Bear.
Canterbury benchmarks its portfolio against key “internal” metrics, in order to measure portfolio efficiency. These metrics are Portfolio State, Portfolio Volatility, and Portfolio Benefit of Diversification. Together, these internal benchmarks create the Portfolio Efficiency Score.
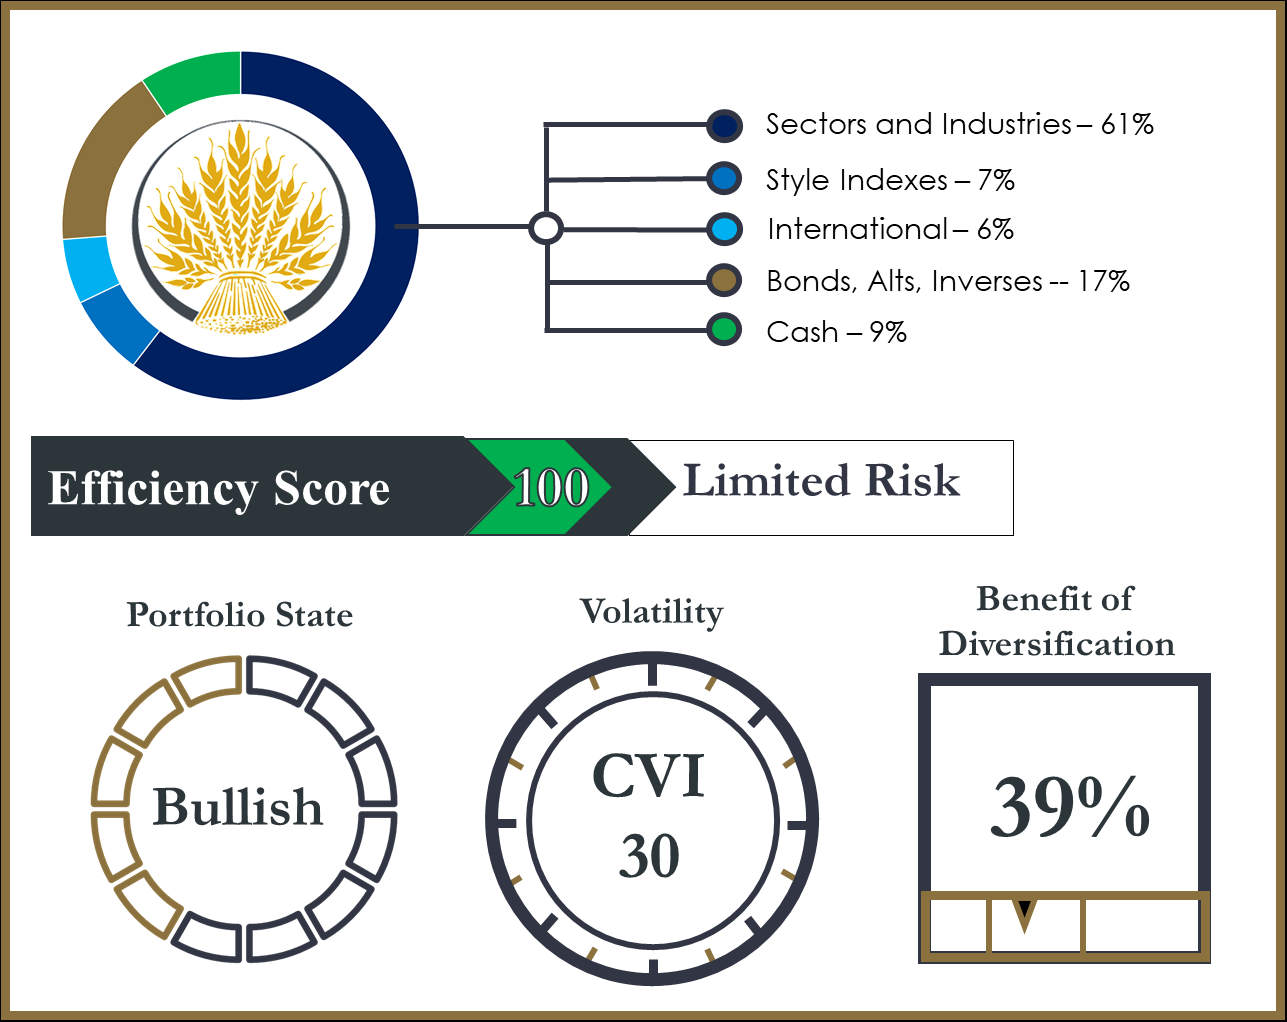
The Portfolio Thermostat is currently efficient for the current market environment. It is also sufficiently diversified. We talked about the S&P sectors in this update and how most sectors performed about the same, while technology far and exceeded the rest of the pack. The technology sector is heavily weighted toward Apple and Microsoft. A drop in these two stocks would lead to a drop in the technology sector, which is also the largest S&P 500 sector, and therefore lead to a drop in the market. In other words, the S&P 500 is not an efficiently diversified portfolio.
The Canterbury Portfolio Thermostat can hold positions in equities, but also alternatives to equities, like bonds or even gold. Gold has seen a nice run up in the last two weeks, and bonds currently have low volatility and other bullish characteristics. When it comes to equity management, the Portfolio Thermostat also has the ability to hold industries. So, while the healthcare sector was being weighed down for most of the year by pharmaceuticals, the Thermostat held a position in medical devices, which saw bullish characteristics for all of 2019.
Bottom Line
The S&P 500 had a nice little rally at the end of the year, mostly was led by technology for most of year (which was strongly led by Microsoft and Apple). While most sectors did perform well, this is somewhat misleading considering the markets low of a trading anomaly occurred right at the end of the 2018. This is the first time in 20 years that only 2 sectors outperformed the overall market.
Every liquid traded security will have both bull and bear markets. This can be seen in the charts of pharmaceuticals, medical devices, and healthcare. Healthcare had been moving sideways for most of the year, and ended with a strong rally. This is because it has a heavy allocation to pharmaceuticals, which had been bearish, but substantially rallied to end 2019. On the other hand medical devices had a strong year characterized by low volatility and rising prices. Just goes to show that there is a time to own each security and a time not to.
This article was submitted by Canterbury Investment Management, a participant in the ETF Strategist Channel.
