The TETF.Index update takes a different track this week. In breaking down the access to the $168.6 Billion Emerging Markets ETF opportunity, it is clear that security selection across about 70 ETFs matters a great deal.
Fees can be as low as 11 Bps for the SPDR MSCI Emerging Market (SPEM) and as high as high as 90 Bps for the Invesco DWA Emerging Market Momentum (PIE), but more important than fee is how investors are “Smart about their Beta” by drilling down in identifying their active share in the index construction. This is why advisors need to be practical with how they manage their portfolio fee allocation. The ETF Think Tank tools like the SmartCost™ calculator were developed to analyze such portfolio issues.
Beyond just fee, ETFs are also about diversification, transparency, and differentiated portfolio construction. To that point, this week we want to share the broad comparison tool from the ETF Think Tank.
![]()

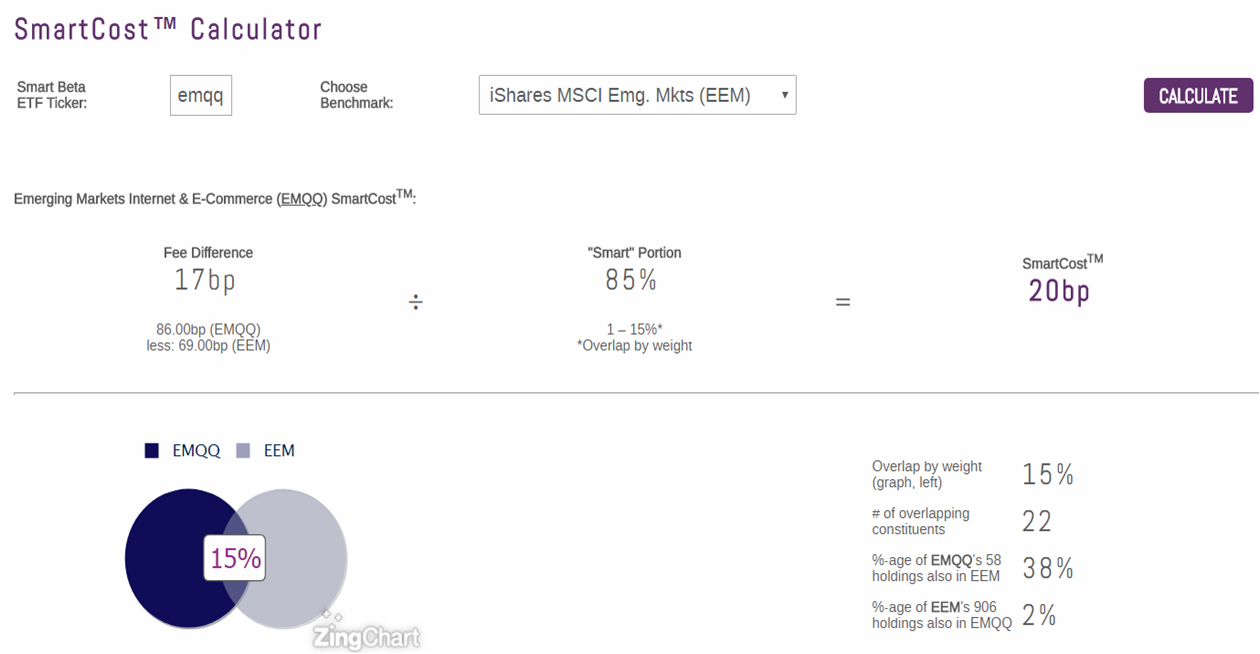
As a quick screen tool provides broadly what ETFs overlap, this is helpful in budgeting fee allocation across a portfolio so that investors can be Smarter about their Beta. Too often allocators focus the most on simply screening in isolation for the lowest cost rather than the full price of the combined cost of what you they are actually paying for. This means that they may not be truly optimizing their fee budget and arbitrarily eliminating newer satellite positions that could create alpha. The key is to know how much fee is allocated per unit of active share, a concept Toroso calls “SmartCost”. The chart below illustrates how we calculate the Smart Cost of EMQQ vs EEM: