
In our last few updates, we have mentioned both the Russell 2000 and the S&P 1500 Advance Decline Line. This week’s brief update will focus on developments within each of these indexes.
Advance Decline Line
When we last discussed the Advance-Decline, which measures market participation, we mentioned that the markets were being carried higher by a select few larger capitalized securities. In other words, the bigger names were rising while a majority of stocks fell flat to down. Below is an excerpt from our November 2nd weekly update:
A rising tide should lift all ships. You do not want to see the generals out in front while the troops retreat or fall back.
Here is a chart of S&P 500 and the S&P 1500 Advance-Decline Line, which shows the flat A/D Line with a rising market. The A/D line (market breadth—participation) has gone sideways for 6 months now while the market has risen.
Fortunately, the latest rise in the markets has seen more participation among securities. Recently, the Advance-Decline Line has broken out of a 6-month flat range. The market has gone higher, and a rising tide has started lifting all ships, rather than just a few leading the way. You can see this breakout in the A/D Line in the chart below:

Source: AIQ Trading Expert Pro
Russell 2000
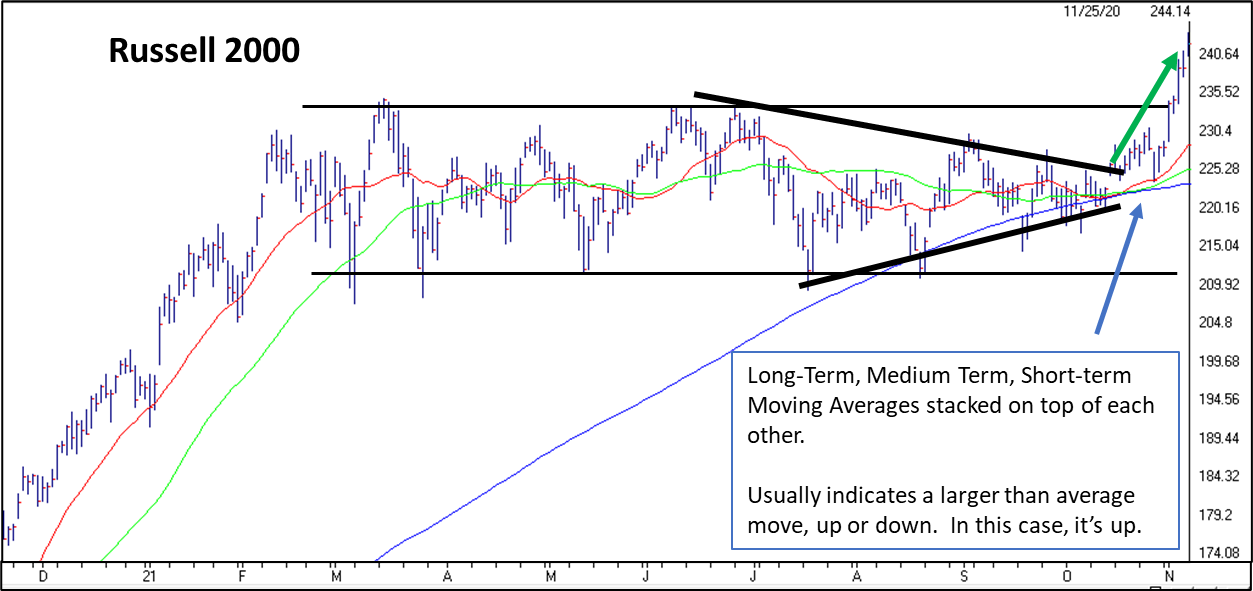
Since the Advance Decline Line rose higher with the market, that would mean there is broader participation among stocks. This can also be seen the Russell 2000. Through most of this year, the Russell had traded within a tight range, and recently condensed into a triangular pattern. Here is what we wrote about the Russell in our October 26th weekly update:
When the moving averages become tight, it usually foreshadows a larger than average move, in either direction. The decline in volume indicates a “lack of conviction” among traders in terms of the direction the security will move.
You can also see that the Russell has put in a series of higher lows and lower highs, forming a triangular-looking pattern. Short-term volatility (as measured by the Canterbury Volatility Index) has been declining. This has the makings of a “squeezed down spring” that is ready to release pent up pressure. We will be watching for which direction the Russell breaks to.
Within the last week, the Russell has broken out, experiencing a larger than average move to the upside. As we discussed in October, the triangular pattern combined with the scrunched moving averages, indicated that the Russell was probably going to experience a larger than average move either up or down. Last week, the Russell was up more than 6%, finally breaking out of that tight range:
Source: AIQ Trading Expert Pro
Bottom Line
With the Russell 2000 (small cap stocks) leading the way, it is no surprise that we see a new high in the A/D Line after it had gone flat for several months. Right now, it appears that the rising tide is lifting all ships. Given the economic views as of lately, I think many would have predicted that the Russell might have broken down out the tight range. Goes to show that markets are counterintuitive. We do not know how long the favorable characteristics will stay in place, but right now, the breakout on the Russell is positive.
There are still negatives to be aware of in the markets. The larger technology-related sectors continue to lead the way, but we are seeing a bit more participation among the smaller securities finally. There is plenty of negative news out there relating to the economy, but the markets do not appear to care much at the moment. We do not know how long this will be the case, but when market environments do begin to shift, there is a process in place to adapt the portfolio accordingly.
