
By Canterbury Investment Management
Market State 1- Bullish: The S&P 500 is currently in Market State 1, which is one of the 5 bullish Market State Environments. Canterbury defines Market State Environments as being either bullish, transitional, or bearish. Bullish Market States are characterized by low and decreasing volatility, and therefore low risk. Most new market highs occur during Market State 1, which is what we are seeing happen right now.
Watch: Canterbury Weekly Update 12.30.2019
Canterbury Volatility Index (CVI)- CVI 46: The Canterbury Volatility Index is currently low and decreasing. It is hovering on the cusp of extreme low volatility. Extreme low volatility is CVI levels below 45. Low volatility is similar to the squeezing down of a spring in that you are more likely to see a “spike” in volatility, in the form of an outlier day- up or down. Short-term volatility, as measured by a 10-day volatility index, is currently already in extreme low territory at CVI 29.
Comment
The market has seen a sharp advance during the month of December, and over the last few months in general. Contrast this to December 2018, where the market fell by 20% over a short amount of time. As we come to the end of the year, it is important to remember that markets simply do not work on a calendar basis. While 2019 might show a sharp rise in the markets, this is coming off the low of December 2018- a period of high drawdown and high volatility. Markets do not shut off and restart each year. Investing is a lifetime endeavor, and the game constantly continues.
As we begin to head into the new year, which will be a year littered with election ads and market predictions, there is no one that can actually predict the future of the markets, just like your home thermostat cannot predict the weather two months from now. Fortunately, however, we can look at what is happening in the markets right now, and make the necessary adjustments to our portfolios as market conditions begin to change.
It was mentioned a few paragraphs ago that the stock market has seen a sharp advance during the last few months. Oftentimes in markets, sharp advances are associated with sharp declines- just as December 2018’s sharp decline anomaly was followed by a sharp advance to begin 2019.
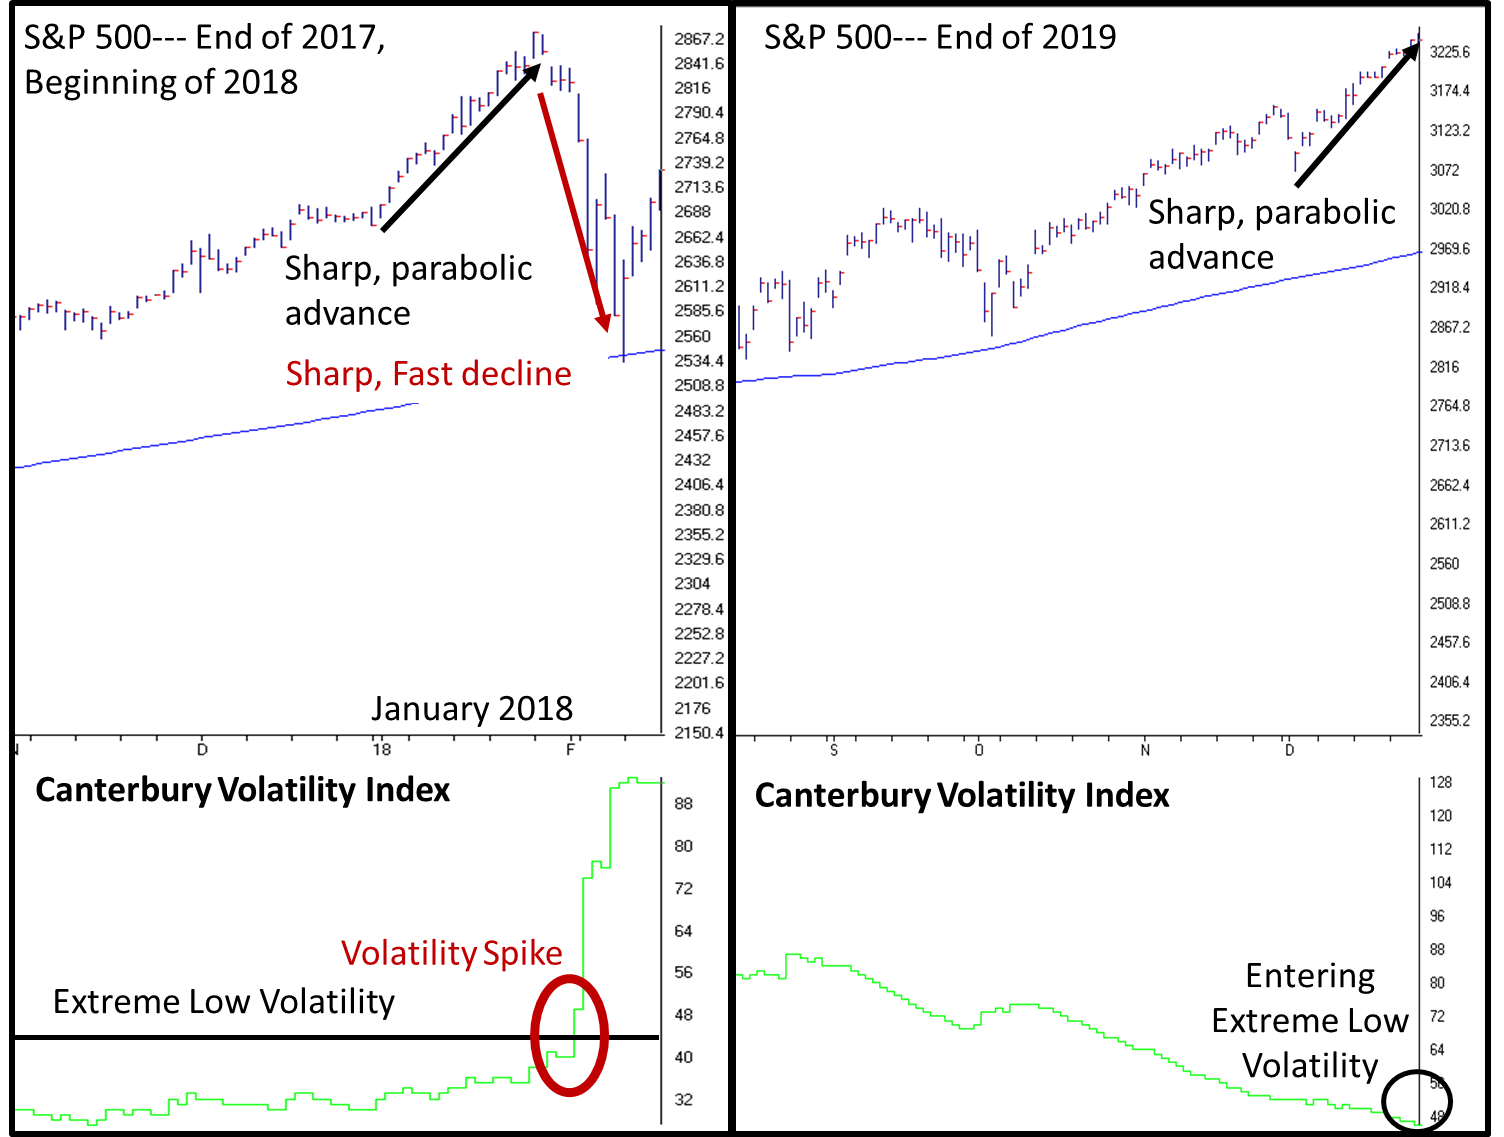
Just as an observation, the current state of the market looks similar to what it did to begin 2018. Now, markets do not usually repeat themselves, but can often rhyme. The feelings and emotions that occur in one market environment, might occur again in a similar market later on. Looking at a chart of the end of 2017 and beginning of 2018, and comparing it to a chart of today, there are a few similarities we can highlight:
Source: AIQ
In the chart of the S&P 500 during the start of 2018, you will notice that there is a sharp, parabolic advance during the month of January. This advance is accompanied by extreme low volatility. We have mentioned in this update, and in several previous updates, that extreme low volatility may result in a volatility spike and a few outlier days. Notice, that following the parabolic rise in January 2018, the market saw a spike in volatility, and a sharp, fast decline.
Today, volatility levels are approaching extreme low levels. Also, the market has seen a parabolic rise similar to the one seen in January of 2018. Now, that is not to say that today’s market will necessarily see the same result, but it is an observation to be aware of. We often see sharp declines come with sharp rallies, and spikes in volatility occur when there is extreme low volatility.
Portfolio Efficiency
The Canterbury Portfolio Thermostat does not aim to compete against any individual index or blended benchmark. We know that portfolio efficiency is a moving target, and all asset classes will go in and out of favor. The Portfolio Thermostat is an Adaptive Portfolio Strategy designed to navigate various markets and create an efficient portfolio for today’s environment- Bull or Bear.
Canterbury benchmarks its portfolio against key “internal” metrics, in order to measure portfolio efficiency. These metrics are Portfolio State, Portfolio Volatility, and Portfolio Benefit of Diversification. Together, these internal benchmarks create the Portfolio Efficiency Score.

Given that the market has had a parabolic advance, the Portfolio Thermostat is currently efficiently positioned for the current market environment, holding a desired Benefit of Diversification and low volatility level. Optimal portfolio efficiency is achieved when the portfolio is in a bullish portfolio state, has low volatility, and an efficient level of diversification for the current market environment.
Bottom Line
As something to be aware of, market pullbacks are certainly likely to occur each calendar year. Our good friend and award-winning market technician, David Vomund wrote that “the odds of a 10% pullback in any given year is far greater than 50%, as the average yearly pullback is 16%.” Pullbacks are normal in markets, and in fact are expected, especially when we see large run-ups. We do not know when, nor the extent to which a pullback might occur, but the Canterbury Portfolio Thermostat is an adaptive portfolio strategy.
An adaptive portfolio is capable of making adjustments to both its holdings and asset allocation in order to navigate changing market conditions. When we do see market pullbacks, some of which will be far greater than the quoted average yearly pullback of -16%, the Portfolio Thermostat can adjust in order to maintain stable volatility and limited drawdown.
https://www.canterburygroup.com/Sharp-Declines-Bring-Sharp-Adva.html
This article was submitted by Canterbury Investment Management, a participant in the ETF Strategist Channel.
