
Heading into 2021, many prognosticators suggested macro-cyclical sectors were poised to benefit from the accommodative monetary, accommodative fiscal policy, and consumer returning to pre-COVID-19 behaviors. Many of these trends existed during the second half of 2020 and were projected into 2021. Figure 1 shows the year-to-date performance of all eleven sectors organized by supersector. The supersector components reflect our view of how behavioral and macroeconomic data impact sector performance. Consistent with the expectations at the start of 2021, the macro-cyclical supersector has outperformed other supersectors on average. Yet given the return dispersion within each supersector, we wanted to review three behavioral data points – momentum, flows, and short interest – for signs of whether the performance trends would continue.
Figure 1. Year-to-Date U.S. Sector Performance
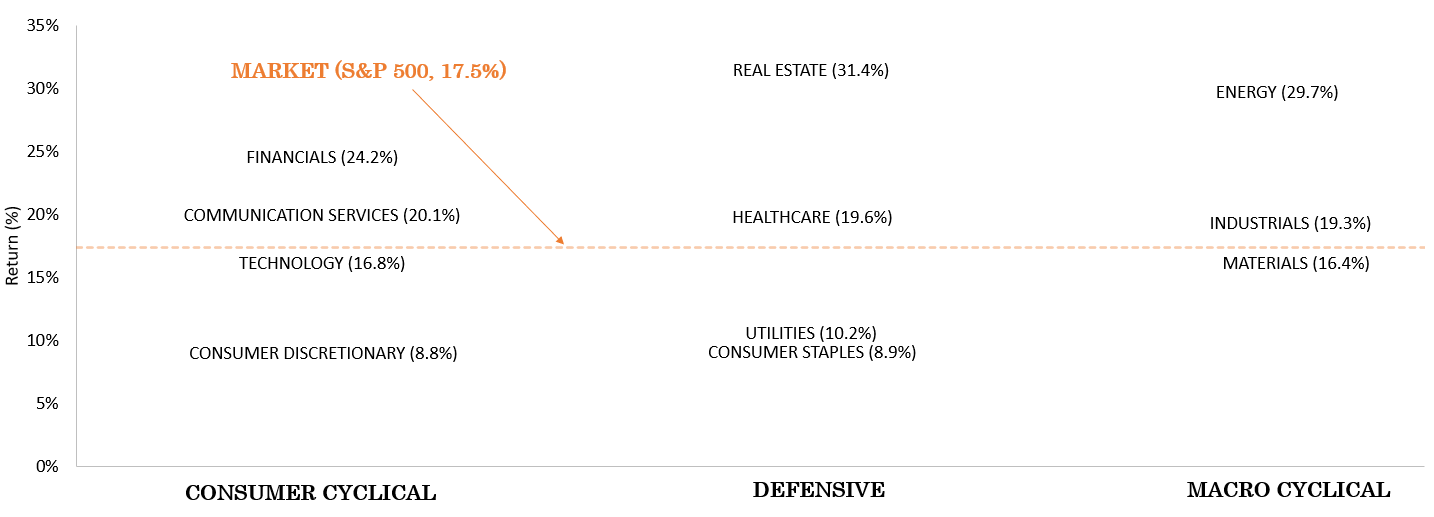
Source: Innealta Capital. Time frame 12/31/2020 to 07/31/2021.
Relative performance (i.e., cross-sectional momentum) is a commonly used behavior that measures the total returns of a basket of securities or markets on a relative basis. Although many variants of this approach exist, the core logic is that the top-performing securities or markets within the basket are more likely to keep outperforming on a relative basis. Figure 2 shows the average return of each supersector over the past 3,6, 9, and 12 months. The illustration shows that the macro-cyclical group has, on average, outperformed the other two groups and the market in three of the four periods analyzed. While the most recent three-month underperformance of the macro-cyclical group is concerning, we believe that the strong relative performance across the other periods supports the notion for continued strong relative performance.
Figure 2 Relative Strength

Source: Innealta Capital. Time frame 07/31/2020 to 07/31/2021. “Consumer Cyclical” refers to the weighted average returns of the Information Technology, Communication Services, Consumer Discretionary, and Financials sectors. “Defensive” refers to the weighted average returns of the Utilities, Consumer Staples, Healthcare, and Real Estate sectors. “Macro Cyclical” refers to the Energy, Industrials, and Materials sectors.” Market” refers to the S&P 500.
While relative strength (i.e., momentum) is a useful behavioral indicator, another we believe is useful is short interest. We would expect that securities, industry groups, or sectors that have a high relative amount of short interest underperform on a relative basis. Figure 3. shows our short interest indicator for each sector across multiple periods. We compared the most recent short interest as a percentage of shares outstanding relative to all values observed for a given security over four different time frames. Thus our short interest indicator is bounded between 0% and 100%, and a higher value is indicative of more shorting pressure relative to each sector’s history. The graph shows that the macro-cyclical group shows the lowest short interest while the consumer discretionary sector shows the highest. Within those groups, quite a lot of dispersion exists. Short interest is very low in the defensive group’s consumer staples and healthcare sectors, while very high in the real estate and utility sectors. In our opinion, the short interest data provides a similar view as the momentum data and supports the view of the continued reflation trade.
Figure 3. Short Interest Indicator
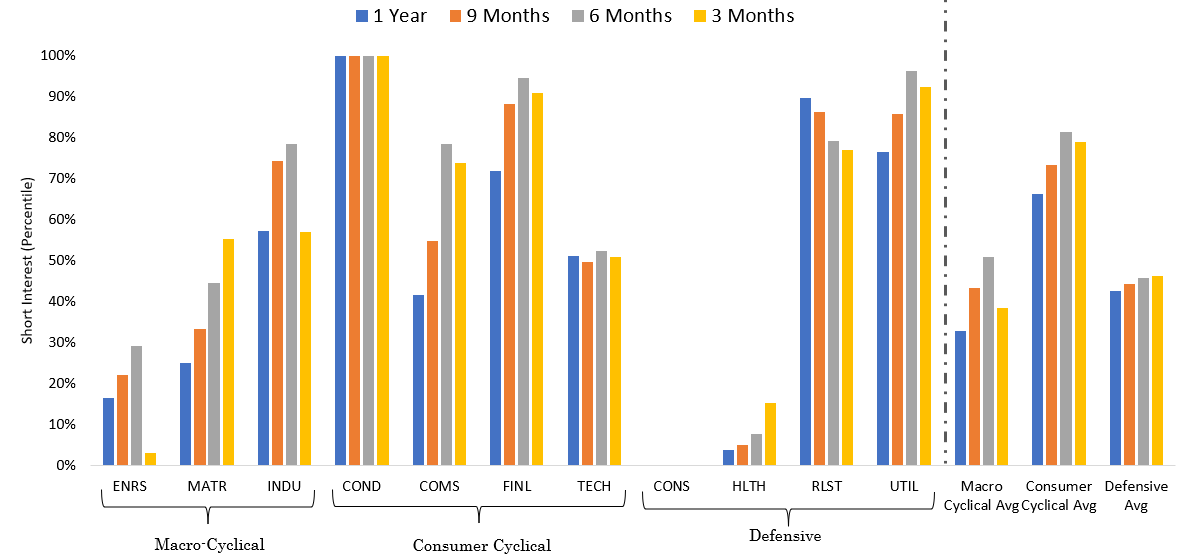
Source: Innealta Capital. Time frame 07/31/2020 to 07/31/2021. Short Interest Indicator calculated as the short interest as a percentage of shares outstanding and then scaled within each market’s unique history. Percentile calculated as the most recent value relative of all values observed across the sample set. Please see disclosures for category descriptions.
Finally, fund flows. In this case, we look for securities, industry groups, or sectors experiencing strong inflows relative to other securities, industry groups, or sectors. While this approach is calculated similarly to relative strength, periods have existed when relative fund flows provide a different insight. Figure 4 shows exchange-traded fund flows over the same periods used for relative strength and short interest. The flows data shows that, on average, the macro-cyclical sectors received large inflows as a percentage of assets, then consumer cyclical or defensive sectors over the past 6, 9, and 12 months. However, over the past three months, defensive and consumer-cyclical sectors have seen more relative inflows. The flows data provides a third behavioral data point that supports the reflation trade.
Figure 4. U.S. Sector Fund Flows
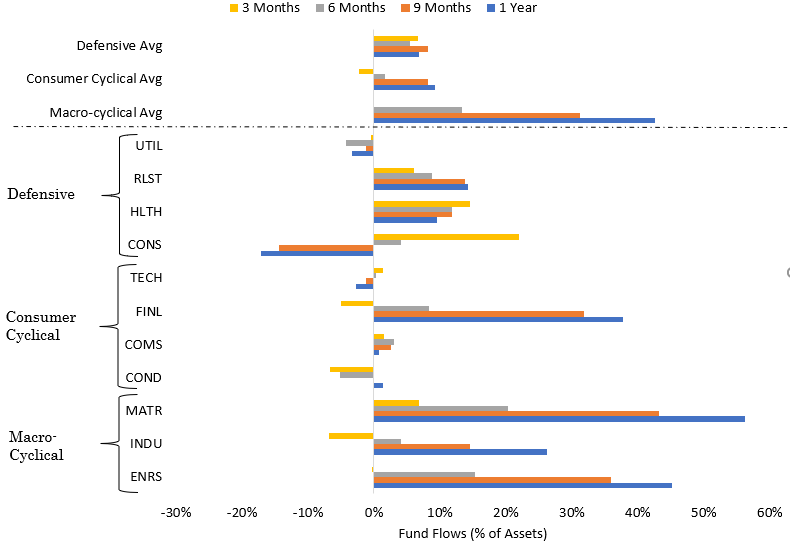
Source: Innealta Capital. As of 07/31/2021. Fund Flows are calculated as the sum of fund flows over the sample period divided by the average assets over the period. Please see disclosures for category descriptions and reference exchange-traded funds used.
After reviewing the behavioral data points above, the behavioral data would appear to make a case for Energy and Materials sectors to continue to outperform over the next two to three months. The Healthcare sector is another interesting sector given its strong fund flows and low short interest. The Consumer Discretionary sector screens week based on relative strength, short interest, and flows on the other side of the spectrum. We would caution anyone from extrapolating the behavioral data, such as the data represented in this document, alone. Rather we prefer and would suggest using the behavioral data in conjunction with corporate fundamental and macroeconomic data to form a robust view of financial markets.
Important Information
“UTIL” refers to the Utilities sector and was proxied using the SPRD Select Utilities exchange-traded fund. “RLST” refers to the Real Estate sector and was proxied using the Vanguard Real Estate exchange-traded fund (“VNQ”). “HLTH” refers to the healthcare sector and was proxied using the SPDR Select Healthcare exchange-traded fund. “CONS” refers to the Consumer Staples sector and was proxied using the SPDR Select Consumer Staples exchange-traded fund (“XLP”). “TECH” refers to the information technology sector and was proxied using the SPDR Select Information Technology exchange-traded fund. “FINL” refers to the financial services sector and was proxied using the SPDR Select Financials exchange-traded fund (“XLF”). “COMS” refers to the communication services sector and was proxied using the SPDR Communication Services exchange-traded fund. “COND” refers to the consumer discretionary sector and was proxied using the SPDR Select Consumer Discretionary exchange-traded fund (“XLY”). “MATR” refers to the materials sector and was proxied using the SPDR Select Materials exchange-traded fund (“XLB”). “INDU” refers to the industrials sector was proxied using the SPDR Industrials exchange-traded fund (“XLI”). “ENRS” refers to the energy sector and was proxied using the SPDR Energy exchange-traded fund (“XLE”).
This material is for informational purposes and is intended to be used for educational and illustrative purposes only. It is not designed to cover every aspect of the relevant markets and is not intended to be used as a general guide to investing or as a source of any specific investment recommendation. It is not intended as an offer or solicitation for the purchase or sale of any financial instrument, investment product or service. This material does not constitute investment advice, nor is it a substitute for such professional advice or services, nor should it be used as a basis for any decision or action that may affect your business. Before making any decision or taking any action that may affect your business, you should consult a qualified professional adviser. In preparing this material we have relied upon data supplied to us by third parties. The information has been compiled from sources believed to be reliable, but no representation or warranty, express or implied, is made by Innealta Capital, LLC as to its accuracy, completeness or correctness. Innealta Capital, LLC does not guarantee that the information supplied is accurate, complete, or timely, or make any warranties with regard to the results obtained from its use. Innealta Capital, LLC has no obligations to update any such information.
839-INN-08/24/2021
