
By the Beaumont Capital Management Investment Team
It’s no secret that a staggering amount of wealth was created during the pandemic and the M2 money supply has hit record highs (in what may be a precursor to some painful times ahead…). However, though consumption has rebounded as the recovery’s progressed and is already stressing supply lines, it’s failed to keep pace with the spike in net worth. Is all this cash destined to sit in savings or investment accounts? The October Beige Book Report acknowledged the rise in consumption and the pressures facing producers as they struggle to keep up and control costs amid significant wage inflation. It also has many growing weary of Fed’s less than “transitory” use of its new favorite buzzword. The S&P 500® meanwhile appears to have shaken off its rocky September, with gains being driven largely by buybacks. Commodities have also continued to climb and though gains from “Dr. Copper” often spark optimism, soaring gas prices will likely be a drag on consumer sentiment even if they’ve yet to approach previous highs.
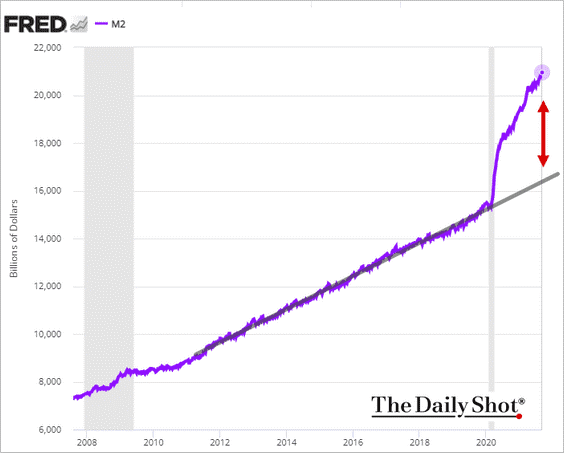
1. Between the stock markets and home values, Americans are flush with record wealth. We also have saved significant amounts of the Covid stimulus packages. Many economists are predicting that all of this will be spent. Yet previous crises point to a very different outcome: We keep it for a rainy day, retirement or investment.

2. The M2 Money Supply is trillions of dollars higher than the pre-Covid trend. This will also provide a tailwind for inflation and withdrawal may be “painful”.
3. The last minimum wage increase was 12 years ago. 40 hours/week times 52 weeks times $7.25/hour equals $15,080/year. Could you live off this? Many companies are doubling minimum wage to attract workers:

4. The gap helps explain our record trade deficits:

5. Like so many segments of the economy, home construction has reverted back into the slow-growth mode of the pre-pandemic trend:

6. This is what the Fed’s Beige Book report for October cited. Just how long is “transitory”?

7. Historically low interest rates have allowed massive spending on Covid, etc. without too much pressure on the Federal budget. This is changing rapidly as rates rise. For instance, government programs including Social Security are getting a 5.9% CPI increase this year. It is easy to spend but quite hard to pay back…

8. Stock buybacks have been the largest driver of the S&P 500’s recent gains:

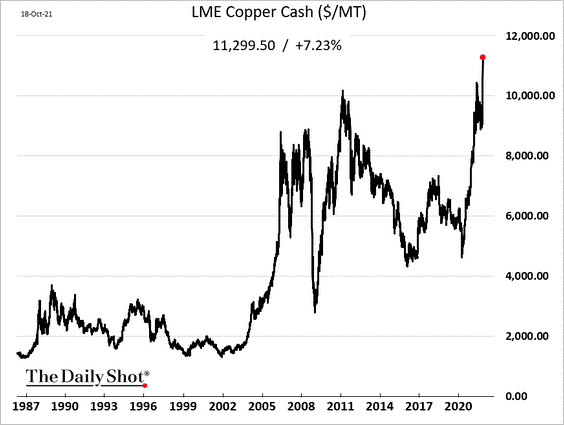
9. Copper prices continue to surge:
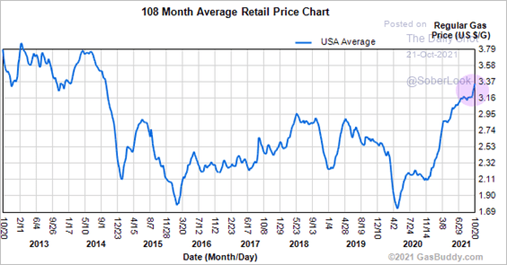
10. Gasoline has doubled in price since the pandemic lows. It has a ways to go before it reaches previous highs:
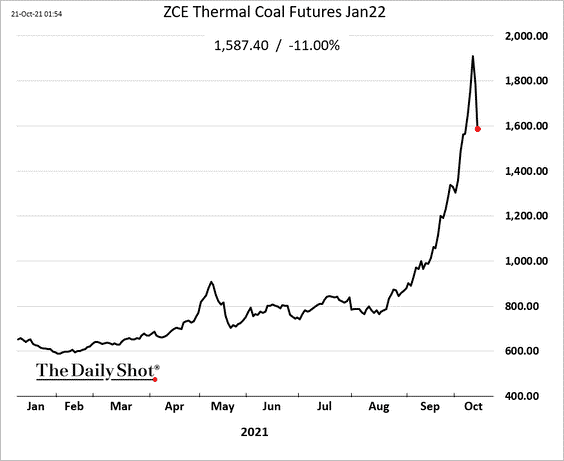
11. The Chinese government caused much of this with their trade war with coal supplier Australia. Now they are talking about intervening. Previous jaw-boning has had only temporary effects plus the global supply shortage may play a role as well:
12. Remember, the total square footage of housing currently under development in China is larger than the state of Delaware! Housing prices just turned negative in China…

For more insights like these, visit BCM’s blog at blog.investbcm.com.
For more news, information, and strategy, visit the ETF Strategist Channel.
Disclosure: The charts and info-graphics contained in this blog are typically based on data obtained from 3rd parties and are believed to be accurate. The commentary included is the opinion of the author and subject to change at any time. Any reference to specific securities or investments are for illustrative purposes only and are not intended as investment advice nor are they a recommendation to take any action. Individual securities mentioned may be held in client accounts. Past performance is no guarantee of future results.
