
By Rob Smyth, Chairman of the Board of Directors
SUMMARY
- While real GDP fell in the second quarter, nominal GDP grew.
- With employment so strong we don’t see signs of a recession yet, but the economy is slowing.
- We believe inflation will remain higher for longer than the market consensus.
THIS TIME IS DIFFERENT, IT’S THE FIRST PERIOD OF HIGH INFLATION IN 40 YEARS
According to one widely followed metric, the US economy is now in recession; at least based on the initial estimate of real Q2 GDP by the Bureau of Economic Analysis. There have now been two consecutive quarters where the economy fell at a seasonally adjusted annual rate. But we believe both declines have been small.
In our view, magnitude matters. In the recent COVID-19 induced recession the economy shrank approximately by 10%, from . To find anything comparable, we must look back to the Great Depression of the 1930s. To add additional context, during the 2008 financial crisis it fell from $14.9 trillion to $14.4 trillion, a 3.5% decline. As you can see from the chart below, apart from these two incidences, the economy has continued to grow during recessions, shown by the shaded areas. This may surprise you and is illustrated by the bottom panel where declines are only seen when the line, or the bars fall below zero.
Measured In Dollars, the Economy is Growing
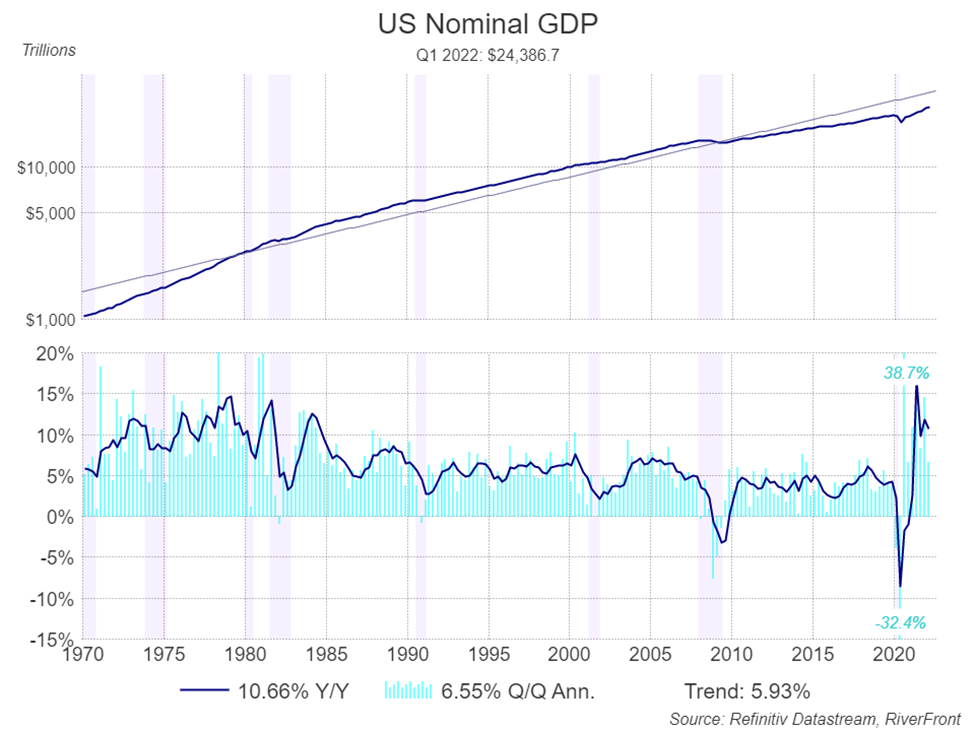
Source: Refinitive Datastream, RiverFront. Data as of Q1 2022. Chart shown for Illustrative purposes.
Although we live in a nominal (dollar based) world, since the 1970’s inflation, economists have focused on ‘real’ GDP.
This takes out the price element and focuses on the volume of goods and services. Economists wanted to know whether the economy was producing more goods and services, or less. To give a simple illustration, real GDP measures the number of cars being sold, nominal GDP measures the dollar value of those sales. In a time of high inflation those two measures can be quite different. The impact of a falling quantity of goods and services is perhaps best reflected in a rising level of unemployment. So, in our previous example, less cars produced can lead to layoffs.
This difference between real and nominal is very evident today. . We do not believe there is a recession in those numbers. We believe the strength of the nominal economy is reflected in the strength of the labor market.
What Matters is the Fed’s View of the Data
On July 27, 2022the Chairman of the Federal Reserve (the Fed), Jay Powell, gave a press conference after the Federal Open Market Committee (FOMC) raised the target interest rate range by 0.75%. It is now 2.25% – 2.5%. In our view, five important themes came out of the press conference:
- The Fed sees no recession: The Fed does not think the economy is currently in recession due to the strength of the labor market – unemployment is just 3.6%, close to an all-time low. Looking at other factors like consumer and business spending, Chairman Powell does think the economy has turned a corner and is slowing down.
- The Fed more likely to do too much rather than too little: Powell said the Fed will err on the side of raising interest rates too much to quell inflation rather than risk doing too little, thereby prioritizing inflation over growth. Chairman Powell gently warned the public to expect some pain in the labor market and the economy in general before this bout of inflation can begin to subside.
- Chairman Powell’s mention of ‘neutral’ misunderstood? Powell described current interest rates as “Neutral” …we believe this was a big surprise to the markets. We believe rates are not neutral for a 9% inflation environment. Just after Chairman Powell’s statement, the markets saw a surge in stocks. However, we think investors misunderstood what Powell was saying. We suspect what Chairman Powell really meant was that 2.5% is a level that is appropriate when the Fed feels inflation has returned close enough to its target of 2% – a level he reiterated repeatedly. If we are right, investors misinterpreted the Fed’s message.
- Wide latitude for Next Meeting: Powell did not guide the markets as to how much the Fed might raise rates at their next meeting in September but did reiterate that they see rates between 3 and 3.5%. He gave a very wide latitude for the September meeting and said the Fed is now ‘data dependent’.
- Risk of a Policy Mistake is High: Chairman Powell said the runway of a ‘soft landing’ i.e., avoiding recession, was now very narrow and the risks are much higher than ‘normal’.
Investors React Positively…but We are Skeptical.
We believe the immediate reaction of markets was for interest rates on bonds to fall, especially on shorter term bonds, suggesting there may ultimately be fewer rate hikes. This caused stocks, especially tech stocks to rally sharply – the S&P 500 rose 2.6% and the NASDAQ rose 4.1% on that day. From this, we conclude that investors raised the probability of a softer landing. The bond market took comfort from the Fed’s commitment to prioritize inflation. The stock market liked the acknowledgement that rates were currently ‘neutral’, and that the Fed was not necessarily committed to a big rise in September.
We disagree with the market’s reaction. We think inflation, while it will soon fall, will remain stubbornly high and several points above the Fed’s 2% target. Thus, we think rates may well rise above 3.5% next year. We believe investors who speculate on where rates will be in the future are now anticipating interest rate declines. We are not. We therefore find ourselves at odds with the prevailing optimism.
What Makes this Rate Hiking Cycle Different?
In a word, ‘inflation’. The Fed has not had to contend with this level and pace of inflation in 40 years, when the current Fed governors were likely in school. We believe there are some parallels to 1994 when the Fed hiked aggressively, but in that case the hikes were ‘preemptive’ as opposed to ‘reactive’ as it clearly is today. Back then Alan Greenspan got ‘ahead’ of inflation, and it barely appeared, in our view. From the ‘Great Recession’ and financial crisis of 2008, through the economic collapse caused by the pandemic, the Fed has been much more concerned of deflation than inflation, in our view. We believe this is why they have rushed to lower interest rates and increase their bond purchases at the first signs of economic trouble. In essence the Fed’s monetary policies have been ‘supportive’ of the investors for 21 years. This has profoundly changed and accounts for much of the bear market in both stocks and bonds so far this year, in our view.
We are Cautious and Patient.
Predicting is always hard but predicting in a ‘new regime’ is especially difficult. We believe that anyone who tells you they have a clear view of how the next year will play out is overconfident. This is a time for humility (one of our core values) and nimbleness. That said, our base case prediction is for inflation to stay higher for longer than the consensus expects, for interest rates to rise more than the consensus expects, and for the remainder of this bear market to take time to play out. Therefore, our balanced portfolios are positioned conservatively, and our team is on high alert. Our investment philosophy is to avoid being dogmatic and stubborn. If the markets continue to tell us we are wrong, our processes will likely cause us to lean more bullish.
Important Disclosure Information
The comments above refer generally to financial markets and not RiverFront portfolios or any related performance. Opinions expressed are current as of the date shown and are subject to change. Past performance is not indicative of future results and diversification does not ensure a profit or protect against loss. All investments carry some level of risk, including loss of principal. An investment cannot be made directly in an index.
Chartered Financial Analyst is a professional designation given by the CFA Institute (formerly AIMR) that measures the competence and integrity of financial analysts. Candidates are required to pass three levels of exams covering areas such as accounting, economics, ethics, money management and security analysis. Four years of investment/financial career experience are required before one can become a CFA charterholder. Enrollees in the program must hold a bachelor’s degree.
Information or data shown or used in this material was received from sources believed to be reliable, but accuracy is not guaranteed.
This report does not provide recipients with information or advice that is sufficient on which to base an investment decision. This report does not take into account the specific investment objectives, financial situation or need of any particular client and may not be suitable for all types of investors. Recipients should consider the contents of this report as a single factor in making an investment decision. Additional fundamental and other analyses would be required to make an investment decision about any individual security identified in this report.
Stocks represent partial ownership of a corporation. If the corporation does well, its value increases, and investors share in the appreciation. However, if it goes bankrupt, or performs poorly, investors can lose their entire initial investment (i.e., the stock price can go to zero). Bonds represent a loan made by an investor to a corporation or government. As such, the investor gets a guaranteed interest rate for a specific period of time and expects to get their original investment back at the end of that time period, along with the interest earned. Investment risk is repayment of the principal (amount invested). In the event of a bankruptcy or other corporate disruption, bonds are senior to stocks. Investors should be aware of these differences prior to investing.
Technical analysis is based on the study of historical price movements and past trend patterns. There are no assurances that movements or trends can or will be duplicated in the future.
In a rising interest rate environment, the value of fixed-income securities generally declines.
Gross domestic product (GDP) is a monetary measure of the market value of all final goods and services produced in a period (quarterly or yearly) of .
Standard & Poor’s (S&P) 500 Index measures the performance of 500 large cap stocks, which together represent about 80% of the total US equities market.
The Consumer Price Index (CPI) measures the monthly change in prices paid by U.S. consumers. The U.S. Bureau of Labor Statistics (BLS) calculates the CPI as a weighted average of prices for a basket of goods and services representative of aggregate U.S. consumer spending.
NASDAQ 100 Index includes 100 of the largest domestic and international non-financial securities listed on the Nasdaq Stock Market based on market capitalization.
Technology and internet-related stocks, especially of smaller, less-seasoned companies, tend to be more volatile than the overall market.
RiverFront Investment Group, LLC (“RiverFront”), is a registered investment adviser with the Securities and Exchange Commission. Registration as an investment adviser does not imply any level of skill or expertise. Any discussion of specific securities is provided for informational purposes only and should not be deemed as investment advice or a recommendation to buy or sell any individual security mentioned. RiverFront is affiliated with Robert W. Baird & Co. Incorporated (“Baird”), member FINRA/SIPC, from its minority ownership interest in RiverFront. RiverFront is owned primarily by its employees through RiverFront Investment Holding Group, LLC, the holding company for RiverFront. Baird Financial Corporation (BFC) is a minority owner of RiverFront Investment Holding Group, LLC and therefore an indirect owner of RiverFront. BFC is the parent company of Robert W. Baird & Co. Incorporated, a registered broker/dealer and investment adviser.
To review other risks and more information about RiverFront, please visit the website at www.riverfrontig.com and the Form ADV, Part 2A. Copyright ©2022 RiverFront Investment Group. All Rights Reserved. ID 2330557
