
By Gary Stringer, Kim Escue and Chad Keller, Stringer Asset Management
Staying with a disciplined and proven investment management process is key to achieving long-term investment success. Our risk first approach, which is driven by our three layers of risk management, is central to every investment decision that we make.
The first level of risk management, our strategic allocation, is based on current market valuations within the context of our three to five-year economic outlook. In aggregate, the data suggests an expectation for equity market total returns of approximately 7% with fixed income likely to return approximately 2.5%. Equity valuations based on an earnings yield of 5% plus a dividend yield of nearly 2% results in the 7% expectation. Similarly, the current SEC yield of approximately 2.5% seems like a reasonable expectation for high quality, taxable domestic bond returns going forward (exhibit 1).
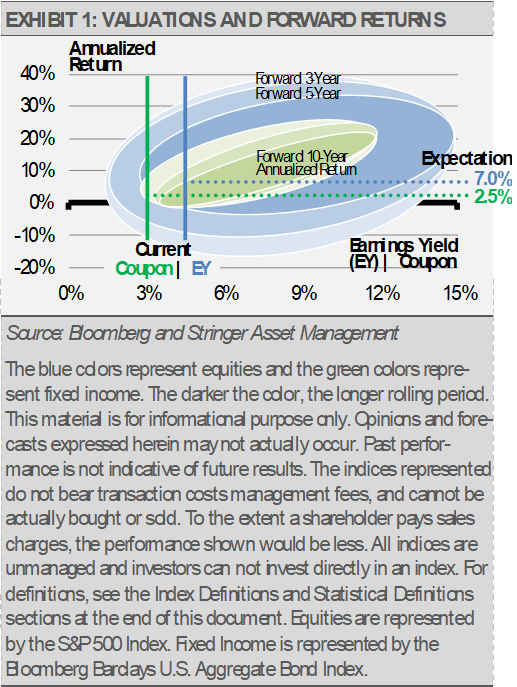
In addition, our economic work suggests stable nominal GDP growth (NGDP), which is real GDP growth plus inflation, of approximately 3.5%, which should result in corporate earnings growth of approximately 5%. Since stock prices move with earnings growth over time, we would expect approximately 5% equity price appreciation plus nearly 2% from dividends. Furthermore, with that NGDP growth expectation, 2.5% is a likely return for bonds going forward based on the historical relationship between NGDP and bond yields.
The second layer of risk management, our tactical allocation, is more nuanced right now. One of our longest lead-time indicators, the slope of the yield curve, which is used to forecast economic expansion or retraction over the next 3-18 months, flashed a cautionary signal just over six months ago.
The yield curve measures the difference between short-term and long-term interest rates. When long-term interest rates are significantly higher than short-term interest rates, we expect the economy to grow. Conversely, when short-term interest rates are higher than long-term interest rates, as we saw from last spring until this fall, the end of the current business cycle typically comes within 3 to 18 months. As a result, we will not be confident that the economy has avoided a downturn until next summer at the earliest. The yield curve has again achieved a positive slope between short-term and long-term bonds, and this has made the markets more optimistic.
However, the yield curve moving in a positive direction as a result of U.S. Federal Reserve interest rate cuts and the stock market making new highs is completely consistent with what we expect to see based on history. While our shorter-term indicators, including PMIs, continue to suggest slow and steady growth in the near-term, our longer-term indicators give us reason to expect economic and market volatility in the new year.
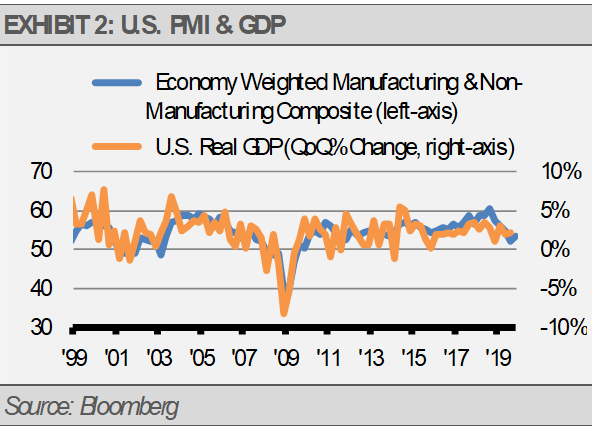
Exhibit 2 illustrates the close relationship between the Purchasing Managers Index (PMI) and real GDP growth. Current PMI levels suggest approximately 2% real GDP growth over the near-term.
It seems to us that the markets have priced in a lot of good news. For example, a “phase one” trade deal with China is unlikely to have a major economic impact. Exports only account for approximately 11% of U.S. GDP and China is only a fraction of that percentage. Furthermore, tariffs on U.S. imports from China would still be higher than before the trade war started.
Since the markets have priced in so much good news, we think that it is imperative that investors be able to make tactical shifts to adjust their risk exposures as the economic and market environments evolve. Investors should be able to adjust risk in real time to protect their portfolio in case of a significant downturn.
THE CASH INDICATOR
Finally, our Cash Indicator, the third layer of risk management, suggests that the markets are far from crisis risk levels. Taken together, our interpretation of this data leads us to believe that downside risks have not dissipated as significantly as the markets suggest and that further upside will be harder to achieve.
As a result, even with global equity markets near all-time highs, we remain fully invested, but cautiously so.

This article was written by Gary Stringer, CIO, Kim Escue, Senior Portfolio Manager, and Chad Keller, COO and CCO at Stringer Asset Management, a participant in the ETF Strategist Channel.
DISCLOSURES
Any forecasts, figures, opinions or investment techniques and strategies explained are Stringer Asset Management LLC’s as of the date of publication. They are considered to be accurate at the time of writing, but no warranty of accuracy is given and no liability in respect to error or omission is accepted. They are subject to change without reference or notification. The views contained herein are not be taken as an advice or a recommendation to buy or sell any investment and the material should not be relied upon as containing sufficient information to support an investment decision. It should be noted that the value of investments and the income from them may fluctuate in accordance with market conditions and taxation agreements and investors may not get back the full amount invested. Past performance and yield may not be a reliable guide to future performance. Current performance may be higher or lower than the performance quoted.
The securities and strategies identified and described may not represent all of the securities purchased, sold or recommended for client accounts. The reader should not assume that an investment in the securities identified was or will be profitable.
Data is provided by various sources and prepared by Stringer Asset Management LLC and has not been verified or audited by an independent accountant.
Index Definitions:
Bloomberg Barclays U.S. Aggregate Bond Index – This Index provides a measure of the U.S. investment grade bond market, which includes investment grade U.S. Government bonds, investment grade corporate bonds, mortgage pass-through securities and asset-backed securities that are publicly offered for sale in the United States. The securities in the Index must have at least 1 year remaining to maturity. In addition, the securities must be denominated in US dollars and must be fixed rate, nonconvertible and taxable.
S&P 500 Index – This Index is a capitalization-weighted index of 500 stocks. The Index is designed to measure performance of a broad domestic economy through changes in the aggregate market value of 500 stocks representing all major industries.
