
By Richard Bernstein, Richard Bernstein Advisors
Insurance policies always carry a premium that must be paid to the insurer by the insured in exchange for protection against an adverse event. It would be nice to receive a huge payout for free when something unfortunate happens, but that isn’t reality. Most of us understand that concept well, but investors too often lose sight of that simple concept when it comes to portfolio management.
Investors forget that portfolio diversification is an insurance policy against one’s view of the world being incorrect. Like all insurance policies, diversification comes with a premium that must be paid. However, investors seem to believe that portfolio diversification is available without an insurance premium. People realize the fantasy of an insurance policy that comes with no premium, but somehow investors remain captivated by the idea that portfolios can be diversified without hindering performance.
At RBA, we try to invest in negatively correlated asset classes rather than uncorrelated asset classes. Whereas uncorrelated asset classes (other than cash) sometimes lose their diversification properties during bear markets, that more rarely happens to negatively correlated asset classes. However, because negatively correlated asset classes generally underperform during an equity bull market, investing in negatively correlated asset classes can be a drag on performance.
That drag on performance is the insurance policy premium.
What if there was no risk?
If one knew with 100% certainty that there was going to be a bull market over the next 12 months, then one would likely be 100% invested in equities. It might be prudent under those circumstances to invest in high beta stocks or to borrow to be more than 100%
in equities or both. Investors tend not to do those things because they cannot perfectly predict equity returns. However, “aggressive” portfolios tend to be less diversified, whereas “conservative” portfolios tend to be more diversified.
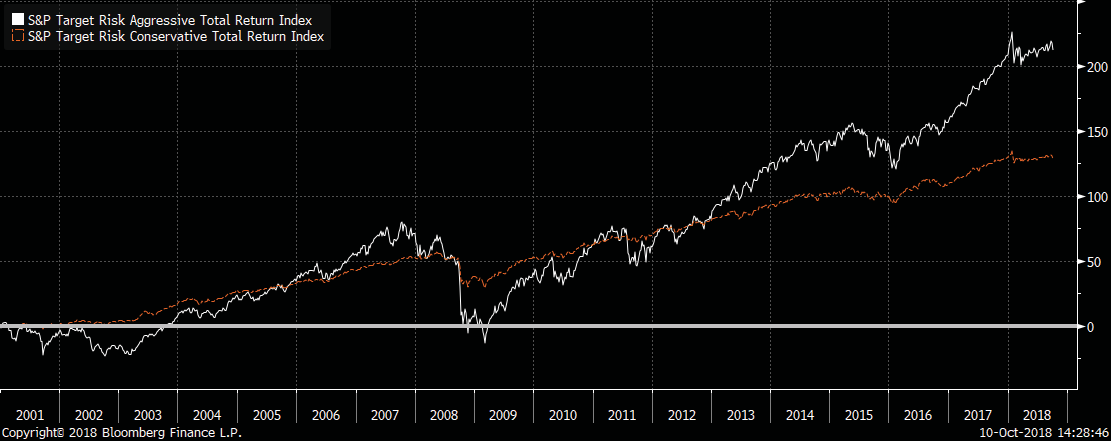
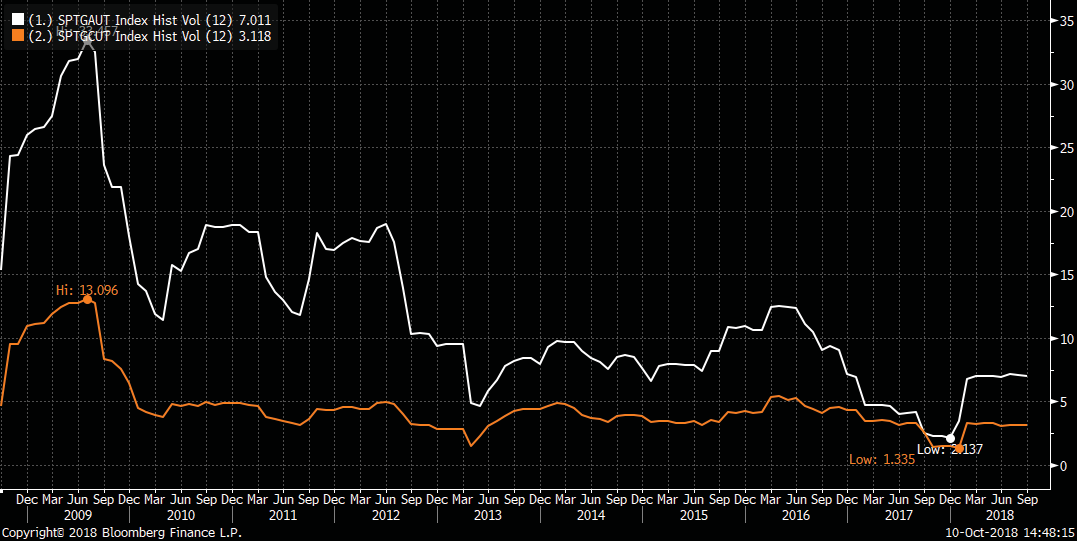
Chart 1 compares the returns of the S&P Target Risk® Aggressive Index with those of the S&P Target Risk® Conservative Index. The more aggressive index currently has roughly 80% in stocks. The more conservative index accentuates asset classes such as bonds (roughly 70%). Chart 2 highlights the 12-month rolling volatility of each portfolio.
Although the aggressive index outperforms the conservative index over the past 17 years, the aggressive index’s volatility is considerably higher. Recently, the volatility of the aggressive index has been more than twice that of the conservative index (7.0% vs. 3.1%).
The performance of these two indices reinforces the idea that there is no “free lunch”. In other words, higher returns necessarily come with more risk, and the insurance against higher volatility and portfolio losses comes with a premium that must be paid called lower returns.
CHART 1:
S&P Target Risk® Aggressive Index vs. S&P Target Risk® Conservative Index: (Dec. 2000 – Sep. 2018)
![]()
Source: Bloomberg Finance L.P. For Index descriptors, see “Index Descriptions” at end of document.
CHART 2:
S&P Target Risk® Aggressive Index vs. S&P Target Risk® Conservative Index: 12-Month Rolling Volatility
Source: Bloomberg Finance L.P.
Diversification and lowering volatility
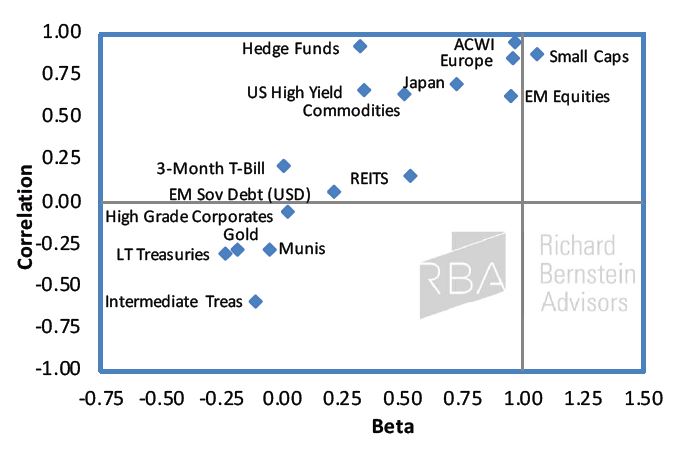
RBA aims to lower the volatility of our portfolios and enhance upside/downside results by investing in negatively correlated asset classes. Chart 3 shows asset class correlations and betas to the S&P 500®. There are several important conclusions from this chart:
- Some asset classes commonly referred to as uncorrelated, such as hedge funds, are quite correlated. Although their betas are low, meaning they tend to move in smaller increments than the overall equity market does, they do seem to move in tandem with the equity
- Diversification is not simply a function of whether an asset class is called “stocks” or “bonds” or “US” or “non-US”. Note that correlations to the S&P 500® tend to increase as assets’ underlying exposures to the business cycle US high yield and Treasuries are both typically categorized as “bonds”, but this analysis suggests their diversification potential is starkly different. See our report from several years ago on this topic. http://www.rbadvisors.com/images/pdfs/Asset_Allocation_2.0.pdf
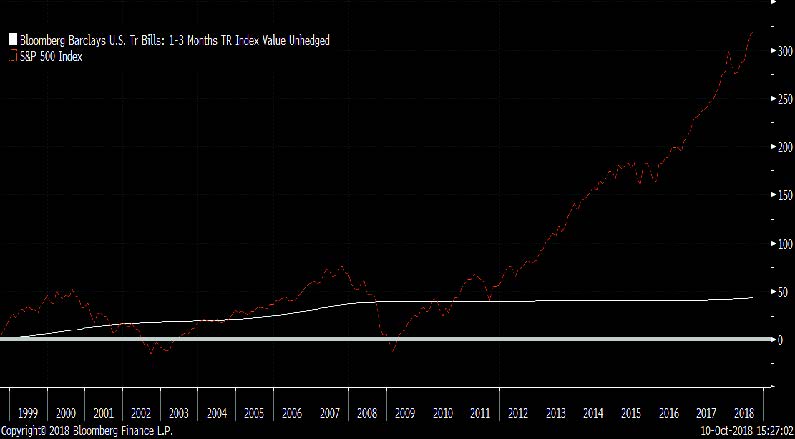
- Cash is indeed an uncorrelated asset class (beta roughly 0.0 and correlation roughly 0%). Chart 4, on the following page, shows the returns of cash versus stocks. The insurance premium associated with investing in cash instead of stocks over the past twenty years (which includes two meaningful bear markets) has been almost 600 basis points/year. That difference in returns indicates it’s VERY expensive to attempt to insure against virtually all risk.
CHART 3:
Asset Class Beta and Correlation to the S&P 500® (Past 5 years as of Sept. 30, 2018)
Source: Richard Bernstein Advisors LLC. Standard & Poor’s, HFRI, MSCI, Bloomberg Finance L.P.,
*ICE® BofAML Bond Indices ®.
*The index data referenced herein is the property of ICE Data Indices, LLC, its affiliates (“ICE Data”) and/or its Third Party Suppliers and has been licensed for use by Richard Bernstein Advisors. ICE Data and its Third Party Suppliers accept no liability in connection with its use.
See http://rbadvisors.com/images/pdfs/ICE_Disclosure.pdf for a full copy of the Disclaimer.
CHART 4:
Cash vs. Stocks Performance Sept. 1998 – Sep. 2018
Source: Bloomberg Finance L.P.
There’s no free lunch!
All insurance has a cost associated with it, and so does diversification because it helps protect against adverse events hurting wealth. The notion that one can effectively diversify a portfolio without paying
an insurance premium of giving up some return sounds enticing, but ultimately seems erroneous.
At RBA, we try to diversify our portfolios and, although we comparison shop for “policies”, we do pay the insurance premium.
This article was written by Richard Bernstein, Chief Executive and Chief Investment Officer of Richard Bernstein Advisors, a participant in the ETF Strategist Channel.
To learn more about RBA’s disciplined approach to macro investing, please contact your local RBA representative. www.rbadvisors.com/images/pdfs/Portfolio_Specialist_Map.pdf.
INDEX DESCRIPTIONS:
The following descriptions, while believed to be accurate, are in some cases abbreviated versions of more detailed or comprehensive definitions available from the sponsors or originators of the respective indices. Anyone interested in such further details is free to consult each such sponsor’s or originator’s website.
The past performance of an index is not a guarantee of future results.
Each index reflects an unmanaged universe of securities without any deduction for advisory fees or other expenses that would reduce actual returns, as well as the reinvestment of all income and dividends. An actual investment in the securities included in the index would require an investor to incur transaction costs, which would lower the performance results. Indices are not actively managed and investors cannot invest directly in the indices.
ACWI: MSCI ACWI Index (ACWI®): The MSCI ACWI® Index is a widely recognized, free-float-adjusted, market-capitalization-weighted index designed to measure the equity-market performance of global developed and emerging markets.
S&P 500®: Standard & Poor’s (S&P) 500® Index: The S&P 500® Index is an unmanaged, capitalization-weighted index designed to measure the performance of the broad US economy through
changes in the aggregate market value of 500 stocks representing all major industries.
Europe: MSCI Europe Index. The MSCI Europe Index is a free- float-adjusted, market-capitalization-weighted index designed to measure the equity-market performance of the developed markets in Europe. The MSCI Europe Index consists of the following 16 developed market country indices: Austria, Belgium, Denmark, Finland, France, Germany, Greece, Ireland, Italy, the Netherlands, Norway, Portugal, Spain, Sweden, Switzerland, and the United Kingdom
EM: MSCI Emerging Markets (EM) Index. The MSCI EM Index is a free-float-adjusted, market-capitalization-weighted index designed to measure the equity-market performance of emerging markets.
