
High quality bubble assets are still bubble assets
In October, we published analysis demonstrating why it’s never too early to sell a bubble. Unsurprisingly, investors have remained reluctant to reduce their bubble exposure, owing to a fear of missing out. Instead, some have advocated reducing bubble exposure by moving up in bubble quality, i.e. avoiding Tech stocks with the most stretched valuations and growth expectations and sticking to established industry leaders with strong cash flows or companies with strong secular tailwinds. Many investors tried to take a similar approach during the late-90s, but unfortunately, with little success.
Strategy 1: Buy proven leaders.
During the Tech Bubble, the largest stocks in the Tech sector were widely considered established winners with solid fundamentals, such as Microsoft, Cisco and Intel. Not only did the stocks of the ten largest “proven leaders” crash by an average of 84% during the bear market, half of them never recovered their peak, while those that did took an average of 15 years to do so. See Table 1 on page 2.
Strategy 2: Buy tomorrow’s winners.
What if investors were able to predict the future winners? Of today’s ten largest Tech stocks, also including Communication Services and Amazon, those that were publicly traded at the peak of the Tech Bubble fell by an average of 72% during the bear market and took over 11 years to recover their peak.
When a bubble crashes, every part of it goes down
Of the 63 stocks within the Tech sector at the peak of the stock market, only four (6%) were able to outperform the S&P 500 during the market crash (by far the lowest of any sector). What investors may find most surprising is that none of the four outperformers were established leaders or future winners. In fact, they were generally higher beta and smaller cap Tech stocks that are all but forgotten today. See Table 3 on page 2 for this list.
|
Chart 1: Percentage of stocks within each sector outperforming the S&P 500® following the 2000 Tech Bubble peak |
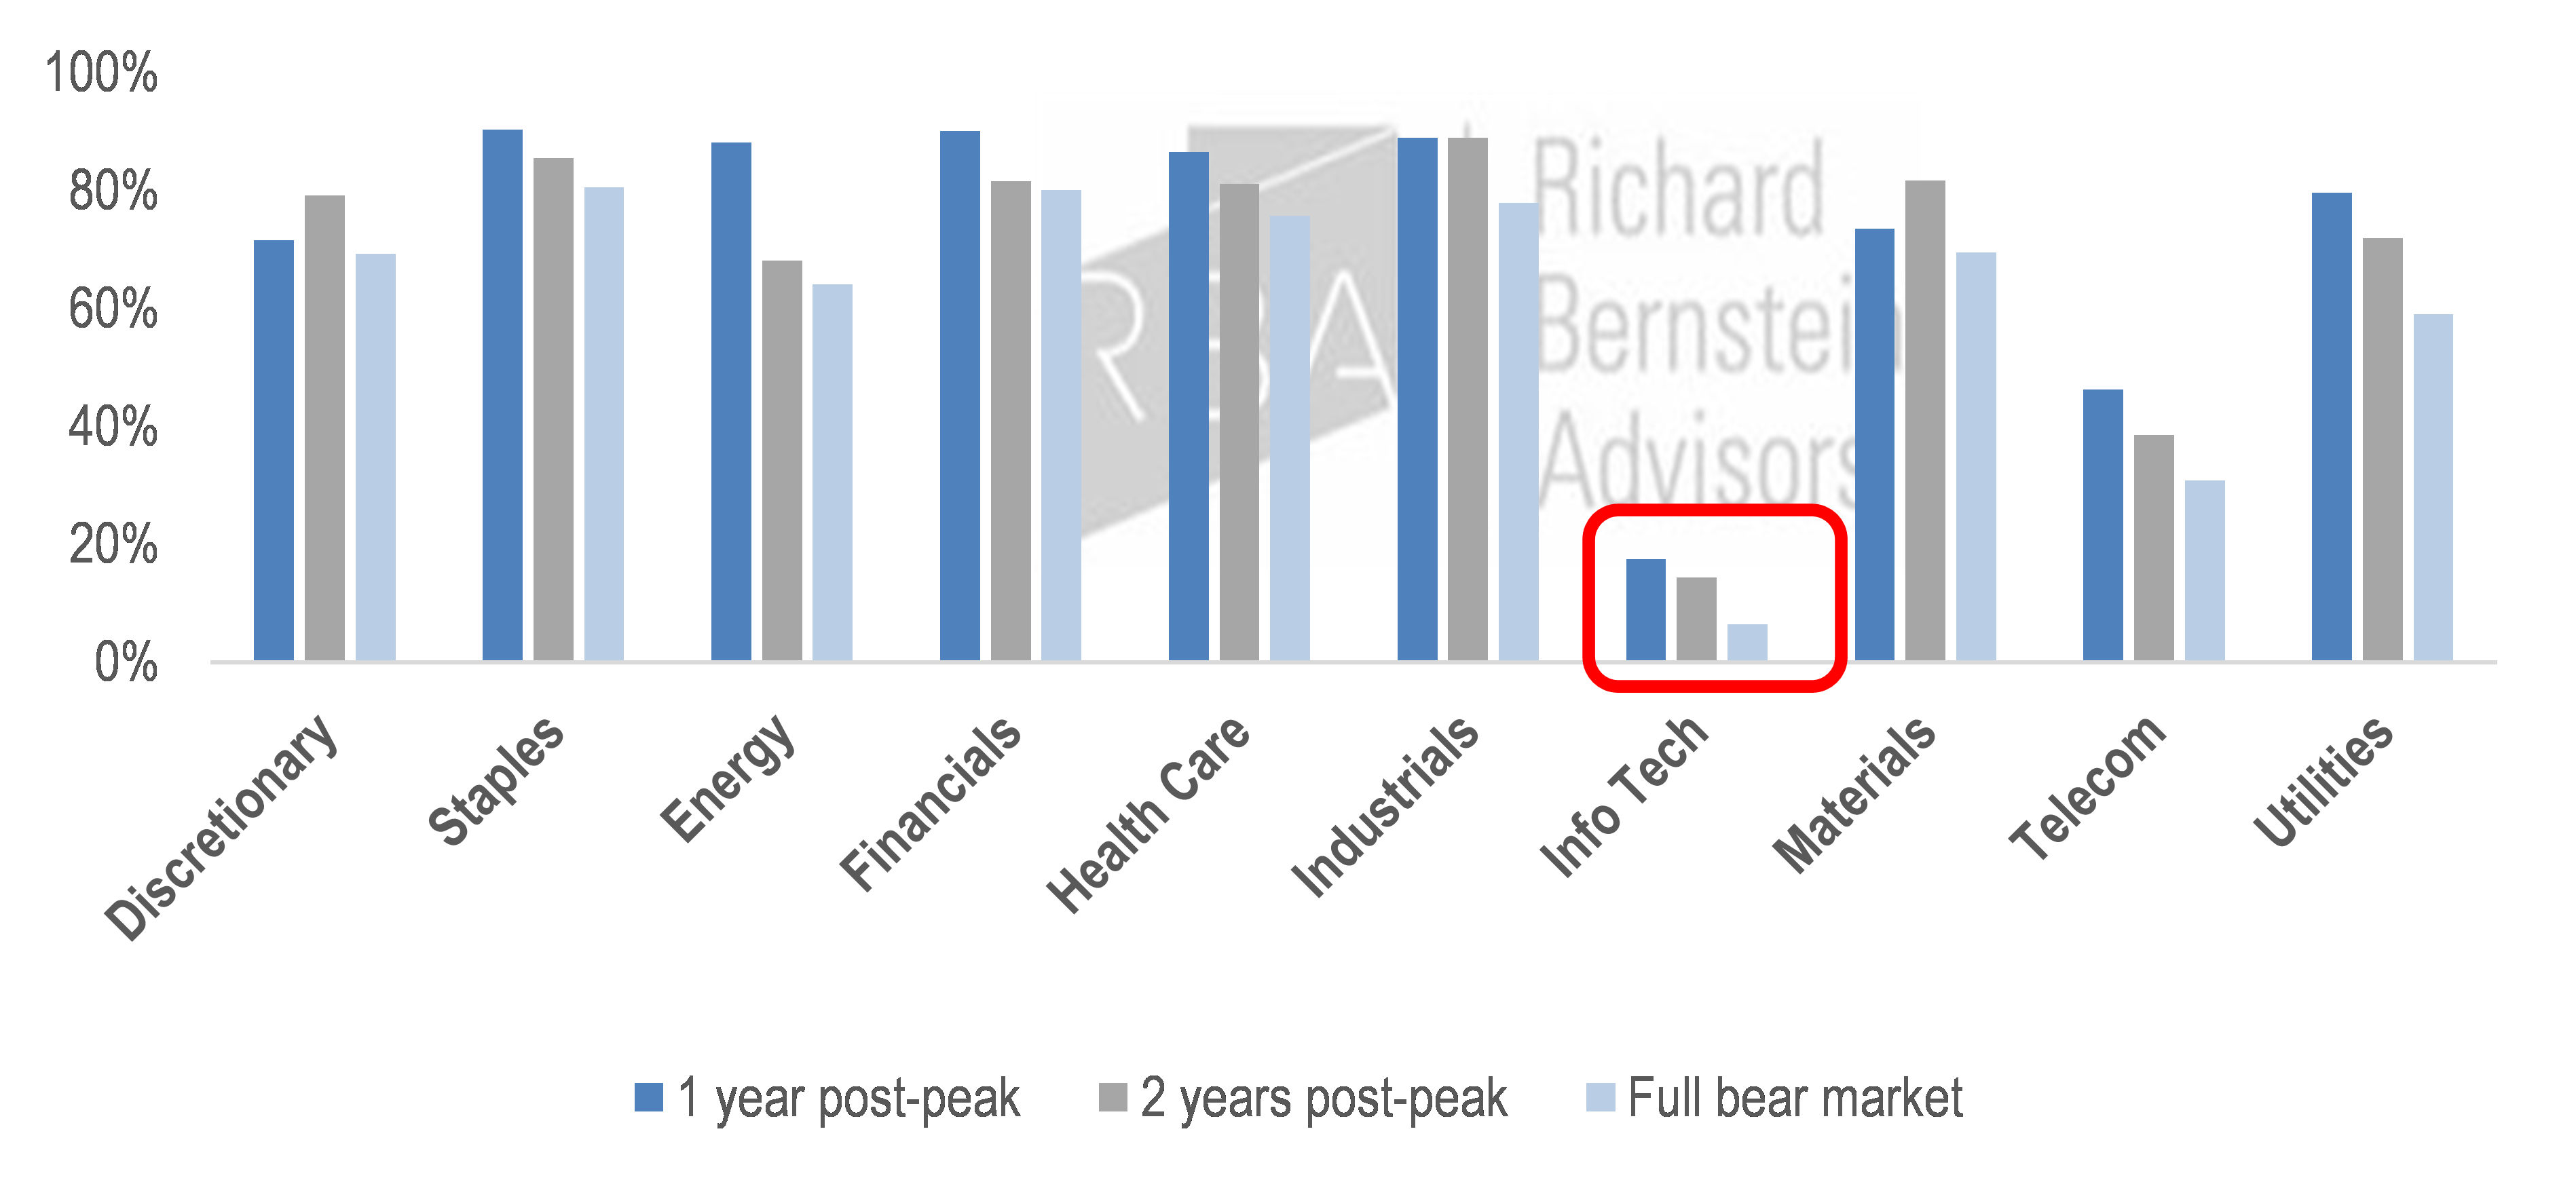 |
| Source: Richard Bernstein Advisors LLC, S&P, Bloomberg |
Defensive characteristics offer little protection inside the bubble
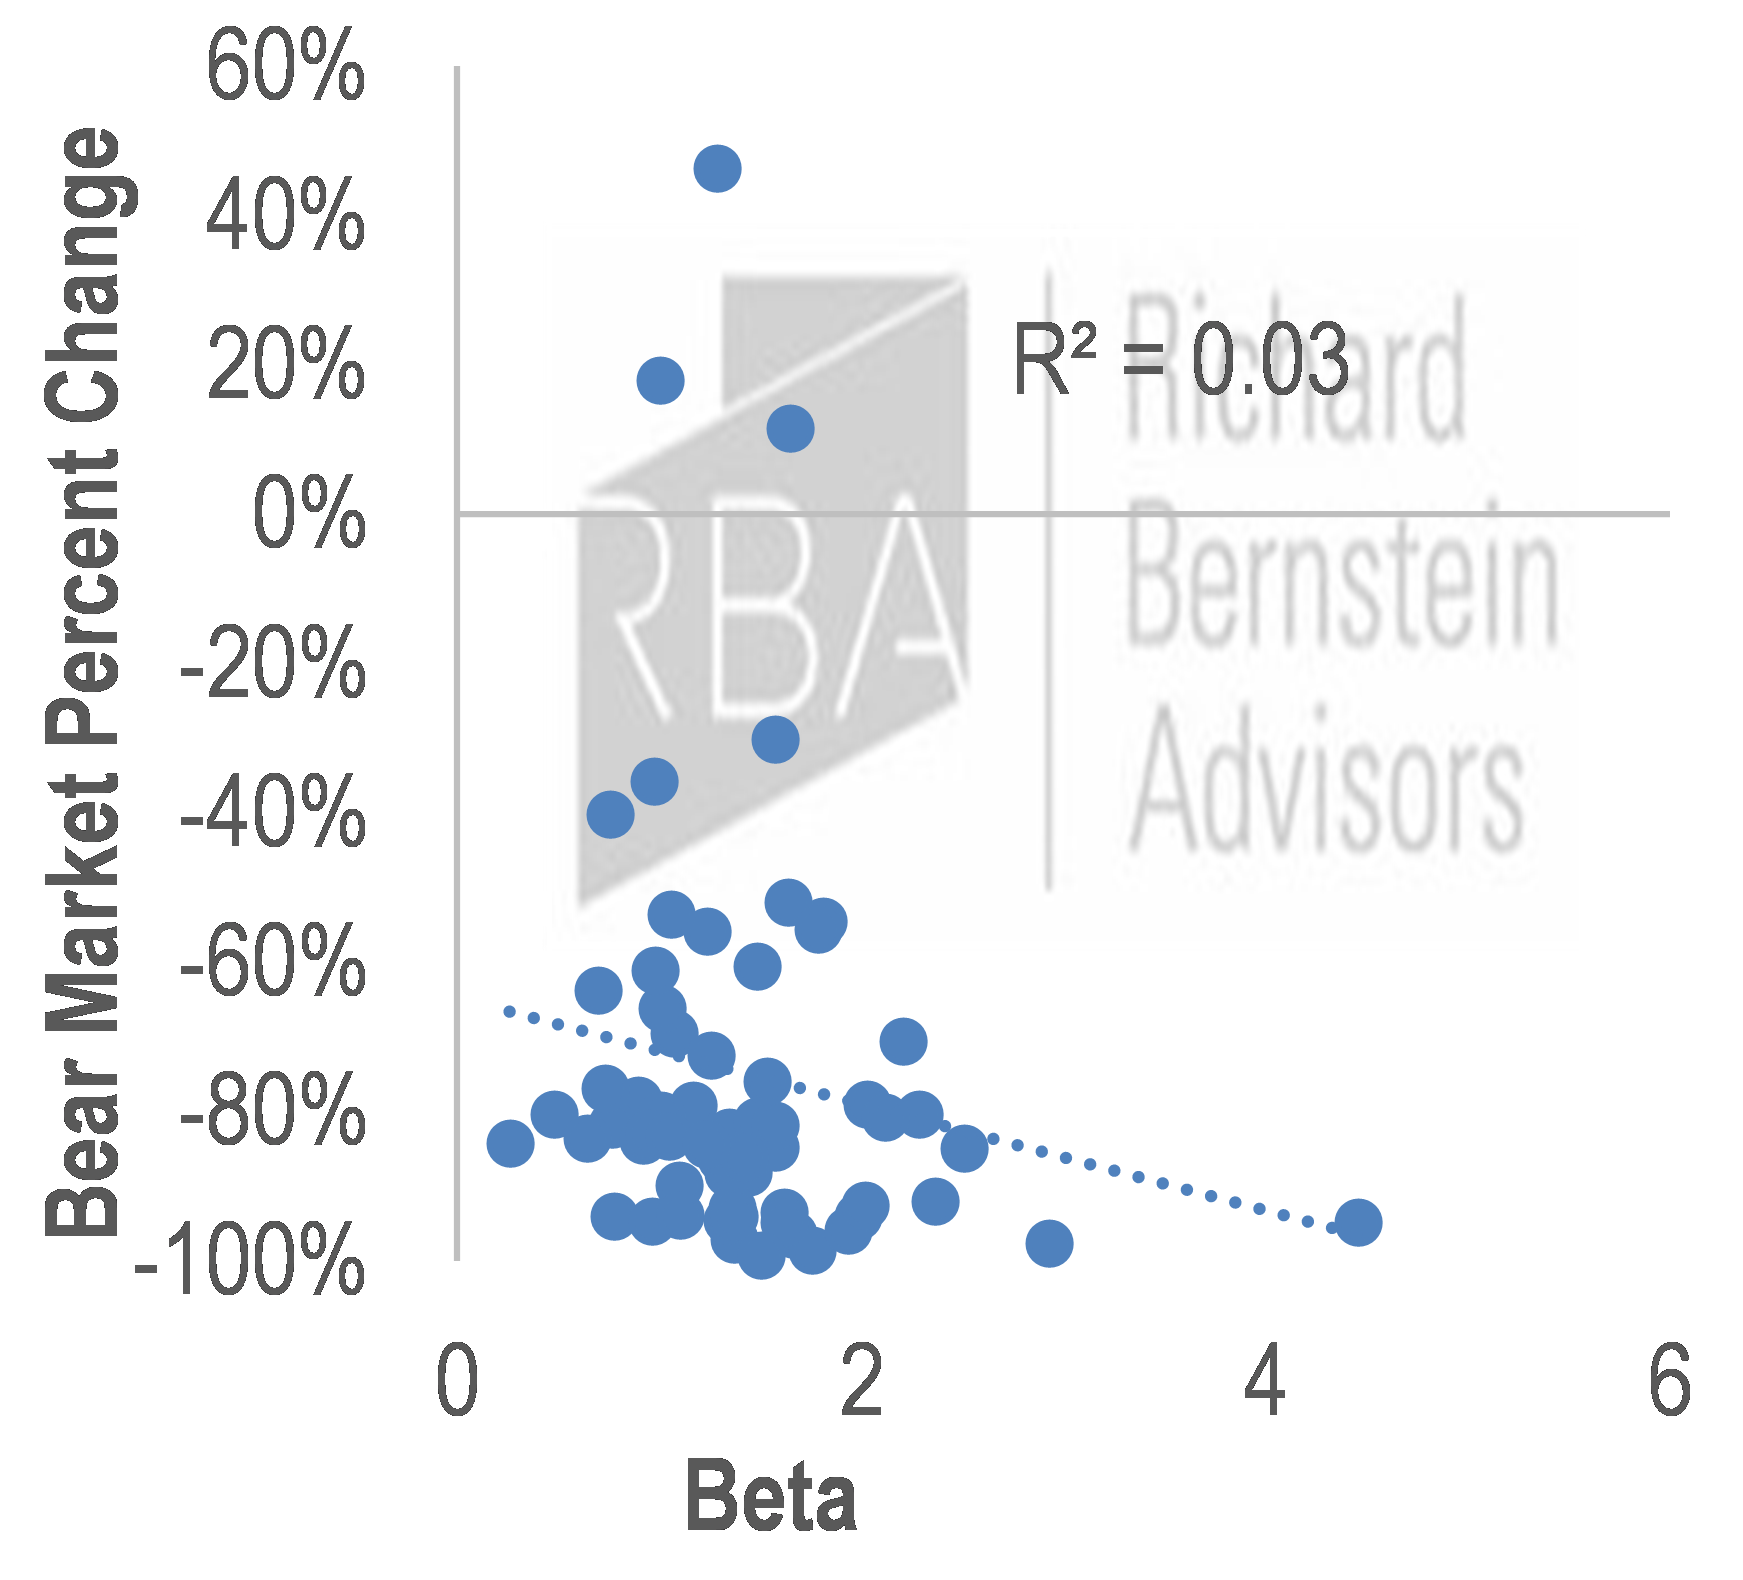
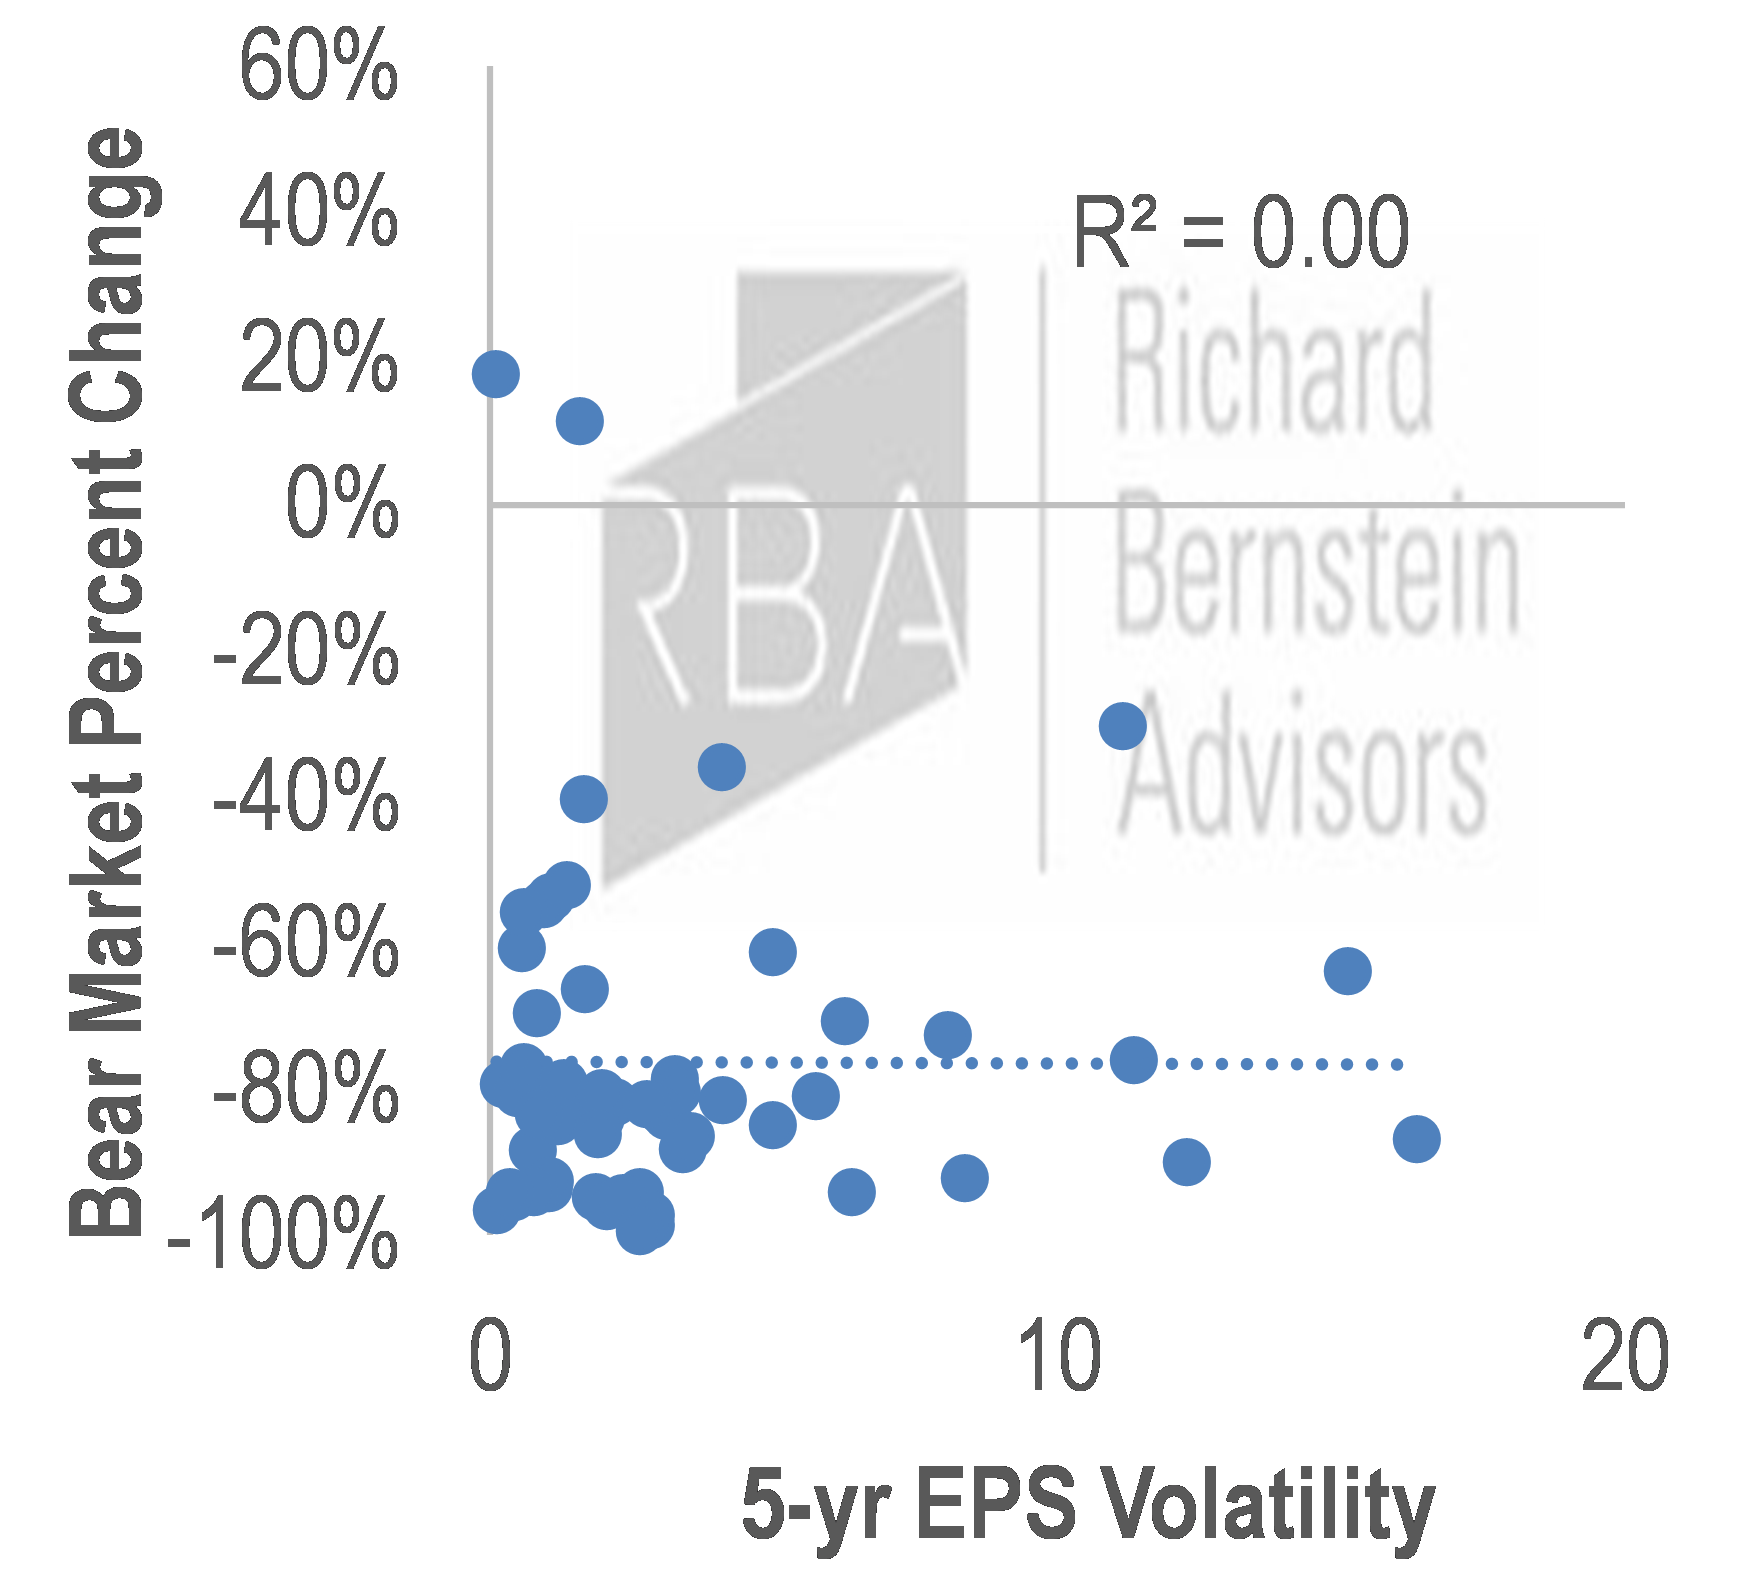
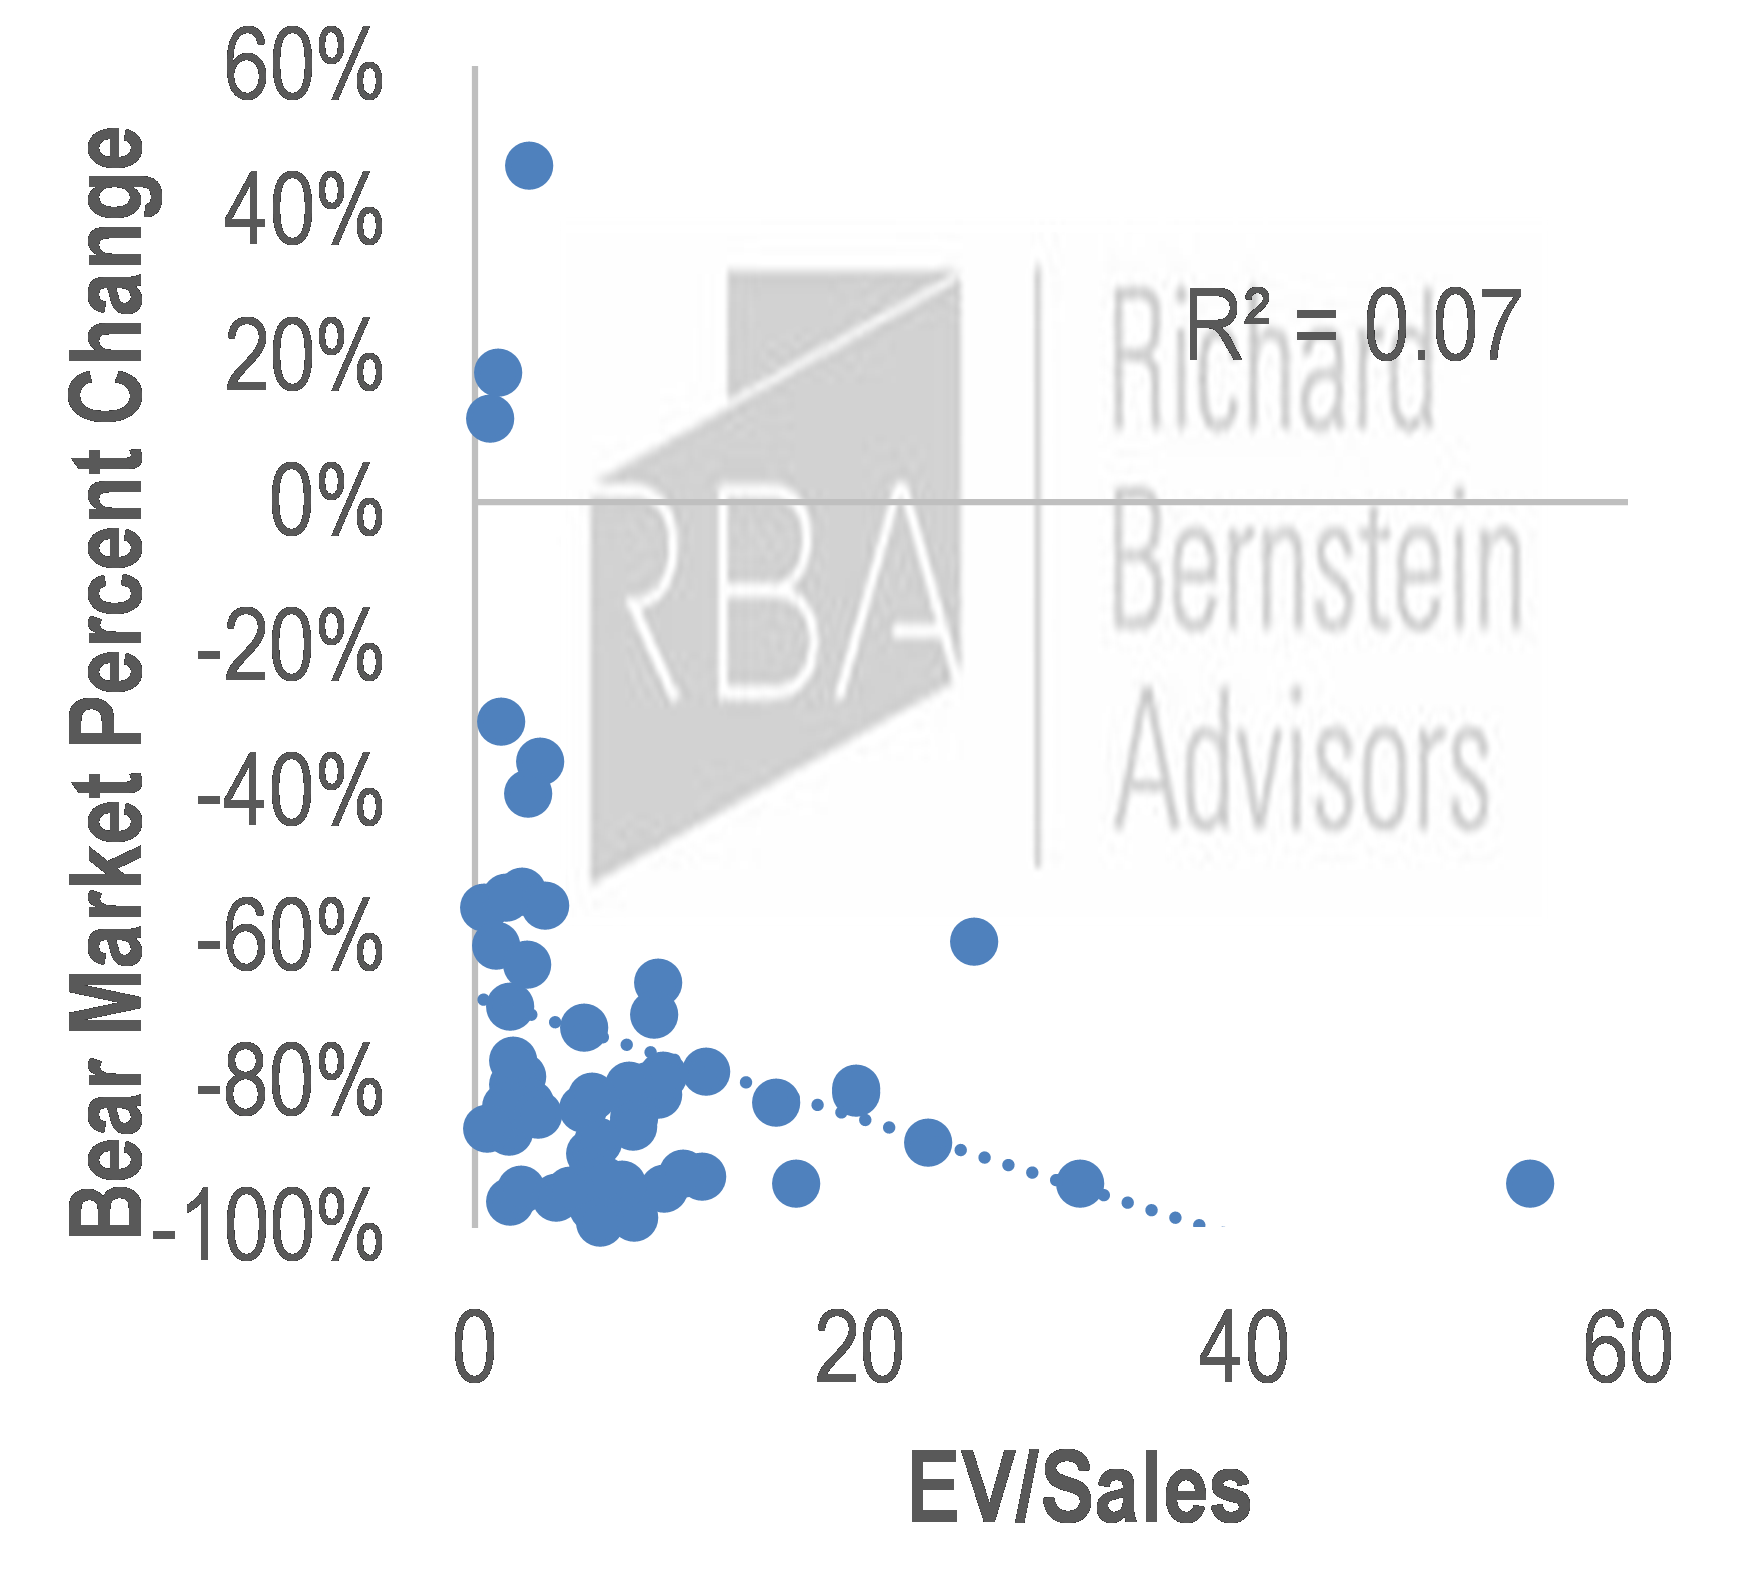
Many investors would understandably expect stocks with lower market sensitivity (beta), stable earnings (low earnings volatility) and/or cheaper valuations to outperform when the bubble deflates. However, we found that within the Tech sector, these characteristics were essentially irrelevant to stock performance as the bubble deflated (Charts 2-4). Thus, our conclusion remains the same as before: The only way to protect from a bubble is to get as far away from it as you can.
| Chart 2: Beta vs. performance | Chart 3: EPS volatility vs. performance | Chart 4: EV/Sales vs. performance | ||
 |
 |
 |
||
| Source: Richard Bernstein Advisors LLC, Bloomberg | ||||
Appendix
- Performance of yesterday’s leaders and tomorrow’s winners during the Tech Bubble collapse, including years to recover the stocks’ prior peaks.
Table 1: Largest Tech stocks at the peak (established leaders) Table 2: Today’s largest Tech-related stocks>1 (future winners)< 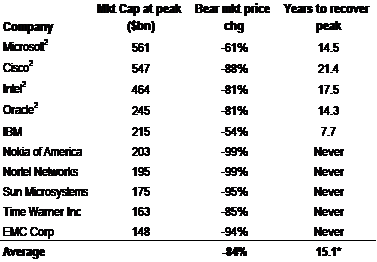
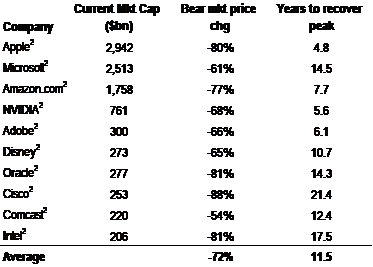
Source: Richard Bernstein Advisors LLC, Bloomberg
*: Excluding those that never recovered their peak price
: Largest S&P 500® stocks by market capitalization as of December 6, 2021 that were publicly traded as of March 24, 2000
: RBA currently holds this security in one or more of its managed portfolios. - Four of the 63 S&P 500® stocks in the Information Technology sector outperformed the S&P 500®, which fell 49% from March 24, 2000 through October 9, 2002. Outside of Millipore (which was essentially a life sciences health care company) betas were all at or well above 1.0, with market caps in the bottom 20th percentile of the sector (IKON was the smallest market cap in the Tech sector).
| Table 3: The four Tech stocks that outperformed the S&P 500® from March 23, 2000 through October 9, 2002 |
 |
| Source: Richard Bernstein Advisors LLC, S&P, Bloomberg Beta: Trailing 5-year monthly beta to S&P 500®; EPS volatility: standard deviation of 5 years of quarterly y/y% EPS growth |
Dan Suzuki, CFA
Deputy Chief Investment Officer
Please feel free to contact your regional portfolio specialist with any questions:
Phone: 212 692 4088
Email: [email protected]
Originally published by Richard Bernstein Advisors on December 20, 2021.
For more news, information, and strategy, visit the ETF Strategist Channel.
For more information About Dan Suzuki, please click here.
Dan Suzuki is registered with Foreside Fund Services, LLC which is not affiliated with Richard Bernstein Advisors LLC or its affiliates.
Nothing contained herein constitutes tax, legal, insurance or investment advice, or the recommendation of or an offer to sell, or the solicitation of an offer to buy or invest in any investment product, vehicle, service or instrument. Such an offer or solicitation may only be made by delivery to a prospective investor of formal offering materials, including subscription or account documents or forms, which include detailed discussions of the terms of the respective product, vehicle, service or instrument, including the principal risk factors that might impact such a purchase or investment, and which should be reviewed carefully by any such investor before making the decision to invest. RBA information may include statements concerning financial market trends and/or individual stocks, and are based on current market conditions, which will fluctuate and may be superseded by subsequent market events or for other reasons. Historic market trends are not reliable indicators of actual future market behavior or future performance of any particular investment which may differ materially and should not be relied upon as such. The investment strategy and broad themes discussed herein may be unsuitable for investors depending on their specific investment objectives and financial situation. Information contained in the material has been obtained from sources believed to be reliable, but not guaranteed. You should note that the materials are provided “as is” without any express or implied warranties. Past performance is not a guarantee of future results. All investments involve a degree of risk, including the risk of loss. No part of RBA’s materials may be reproduced in any form, or referred to in any other publication, without express written permission from RBA. Links to appearances and articles by Richard Bernstein, whether in the press, on television or otherwise, are provided for informational purposes only and in no way should be considered a recommendation of any particular investment product, vehicle, service or instrument or the rendering of investment advice, which must always be evaluated by a prospective investor in consultation with his or her own financial adviser and in light of his or her own circumstances, including the investor’s investment horizon, appetite for risk, and ability to withstand a potential loss of some or all of an investment’s value. Investing is subject to market risks. Investors acknowledge and accept the potential loss of some or all of an investment’s value. Views represented are subject to change at the sole discretion of Richard Bernstein Advisors LLC. Richard Bernstein Advisors LLC does not undertake to advise you of any changes in the views expressed herein.
