
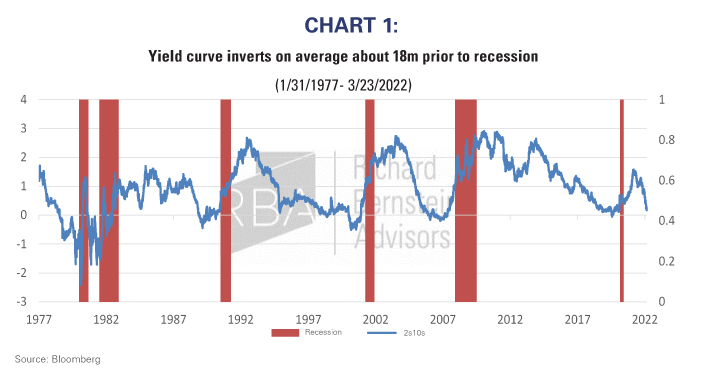
Over the last 40 years the US economy has slipped into recession 6 times. During those 40 years, the difference between 10y yields and 2y yields (2s10s curve) has reliably dipped into negative territory on average about 18m before GDP turns negative (Chart 1). Today the 2s10s curve is once again knocking on the door of becoming inverted (while some curves like the 3s10s and 5s10s already are), causing quite a stir among market watchers that recession is imminent. Though certainly growth may slow as the Fed tries to rein in inflation, our work suggests investors will be better served looking elsewhere for recession signals. In fact, our models show the flatness of the curve could be more a consequence of the Fed’s relentless buying of bonds, and the consequent growth of their balance sheet, rather than because of a looming growth shock. As such, the true fair value of the 2s10s spread could be in the 150bp-200bp range had the Fed never engaged in its multiple rounds of quantitative easing.
Up, down, all around…
The trick with looking at interest rates curves is that investors need to account for two variables: The short end of the curve (the 2y note) and the long end of the curve (the 10y note). Though perhaps obvious, it’s important to highlight that curve flattening can be a function of any combination of directional moves in yield as long as the 2y is increasing by more (decreasing by less) than the 10y.
Depending on how the curve flattens, and why, could make a difference in determining whether the signal it is sending today is the canary in the coal mine, or conversely, nothing but noise.
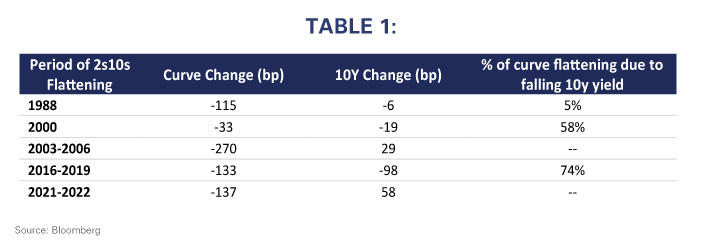
To determine which is the case today, we must ask why the 2s10s curve tends to be a reliable signal of recession? Historically, it is because when the two measures cross, it is an indication that the market expects policy (which drives the 2y note) to become too restrictive, suppressing bank lending and sending the economy into recession (the 10y note indicates long term growth). As such, looking back over the last 4 recessions and the curve inversions that happened before each, we see that 75% of the time the 10y yield went down as the 2y yield increased. And in 2 of the 3 cases, the bulk of the flattening was due to falling 10y yields. In other words, at those times the market priced restrictive policy (reflected in 2y yields moving higher) would stimy long-term nominal growth (10y yields moving lower).
Today we see a very different dynamic.
- The 10y yield has increased 65bp since the recent bout of curve flattening began nearly 1 year ago. An increase in the 10y is not suggestive of fears of a growth slowdown, regardless of what the 2y note is doing.
- The 10y yield, as we have mentioned numerous times, has been anchored by the Fed’s expansion of their balance sheet and ownership of the long end of the curve.
The second point above cannot be overstated. As we have discussed in previous reports, since the Global Financial Crisis (GFC) there have been four main drivers of treasury yields: Inflation, Leading Economic Indicators (LEIs), the Federal Funds Rate, and the size of the Fed’s Balance sheet relative to GDP. All four of those indicators suggest rates today should be closer to 3%. We think the market is finally waking up to this reality.
Further, our work suggests that if the Fed had never engaged in quantitative easing, the 10y would likely be closer to 3.7% This would suggest that without the artificial depression of long end yields, the 2s10s curve should be more in the 150-200bp range rather than the current 23bp. Though the Fed is likely to maintain a sizeable balance sheet, thereby keeping yields relatively anchored versus what would be expected had they never bought bonds, there is clearly scope for yields to increase in the long end over coming quarters. Whether or not this happens with ever higher 2y yields, time will tell, but for now, we would search for other indicators of recession.
Michael Contopoulos
Director of Fixed Income
Please feel free to contact your regional portfolio specialist with any questions:
Phone: 212 692 4088
Email: [email protected]
For more news, information, and strategy, visit the ETF Strategist Channel.
Nothing contained herein constitutes tax, legal, insurance or investment advice, or the recommendation of or an offer to sell, or the solicitation of an offer to buy or invest in any investment product, vehicle, service or instrument. Such an offer or solicitation may only be made by delivery to a prospective investor of formal offering materials, including subscription or account documents or forms, which include detailed discussions of the terms of the respective product, vehicle, service or instrument, including the principal risk factors that might impact such a purchase or investment, and which should be reviewed carefully by any such investor before making the decision to invest. RBA information may include statements concerning financial market trends and/or individual stocks, and are based on current market conditions, which will fluctuate and may be superseded by subsequent market events or for other reasons. Historic market trends are not reliable indicators of actual future market behavior or future performance of any particular investment which may differ materially, and should not be relied upon as such. The investment strategy and broad themes discussed herein may be inappropriate for investors depending on their specific investment objectives and financial situation. Information contained in the material has been obtained from sources believed to be reliable, but not guaranteed. You should note that the materials are provided “as is” without any express or implied warranties. Past performance is not a guarantee of future results. All investments involve a degree of risk, including the risk of loss. No part of RBA’s materials may be reproduced in any form, or referred to in any other publication, without express written permission from RBA. Links to appearances and articles by Richard Bernstein, whether in the press, on television or otherwise, are provided for informational purposes only and in no way should be considered a recommendation of any particular investment product, vehicle, service or instrument or the rendering of investment advice, which must always be evaluated by a prospective investor in consultation with his or her own financial adviser and in light of his or her own circumstances, including the investor’s investment horizon, appetite for risk, and ability to withstand a potential loss of some or all of an investment’s value. Investing is subject to market risks. Investors acknowledge and accept the potential loss of some or all of an investment’s value. Views represented are subject to change at the sole discretion of Richard Bernstein Advisors LLC. Richard Bernstein Advisors LLC does not undertake to advise you of any changes in the views expressed herein.
