
By Rebecca Felton, Senior Market Strategist
SUMMARY
- Equity markets had a strong quarter led by the US with no clear style dominating.
- We expect taxes and inflation to dominate the headlines this summer.
- Security selection is increasingly important as we choose which ‘recovery’ and ‘growth’ sectors to own, hence our ‘barbell approach.’
Most Equity Asset Classes and Sectors Benefit During the Quarter
Anyone who has used a GPS for navigational assistance knows there is rarely only one way to reach our destination. There are usually multiple routes, and each has trade-offs. Some may involve tolls, sometimes there is a scenic route, and detours often pop-up unexpectedly. Using the GPS analogy seems fitting when thinking about the twists and turns experienced during the second quarter of 2021 as we continue on the path to normalcy. Paved with employment trends that are trending positively, consumer and corporate confidence returning to pre-pandemic levels, and a ‘V-shaped’ recovery for corporate earnings, the foundation appears solid. However, detours caused by inflation fears and threats of higher taxes acted as speed bumps along the way.
The strong returns for both the quarter and the trailing twelve months (TTM) illustrate to us that investors continue to look beyond COVID-19, expecting a continued recovery in earnings. Early in the quarter, recovery momentum in Europe boosted performance for developed international equities, but that relative momentum faded due to rising COVID-19 cases resulting in the S&P 500 (US Large-Cap) turning in the strongest performance in the quarter at nearly 8.6%. Ironically, despite a negative return over the trailing twelve-month period, gold increased to over 4% during the second quarter reflecting heightened inflation worries. US Small and Mid-cap equities retained the lead as the strongest performing asset class over the trailing twelve months rising 57.3%.
The table below shows the performance of asset classes on the left and US equity sectors on the right. Returns for both the second quarter and the past 12 months (TTM) are shown. The table is anchored by US Large-Cap equities, which are shaded, and allows for easier comparison to see higher and lower relative performance by each asset class and sector.
Performance: A Closer Look
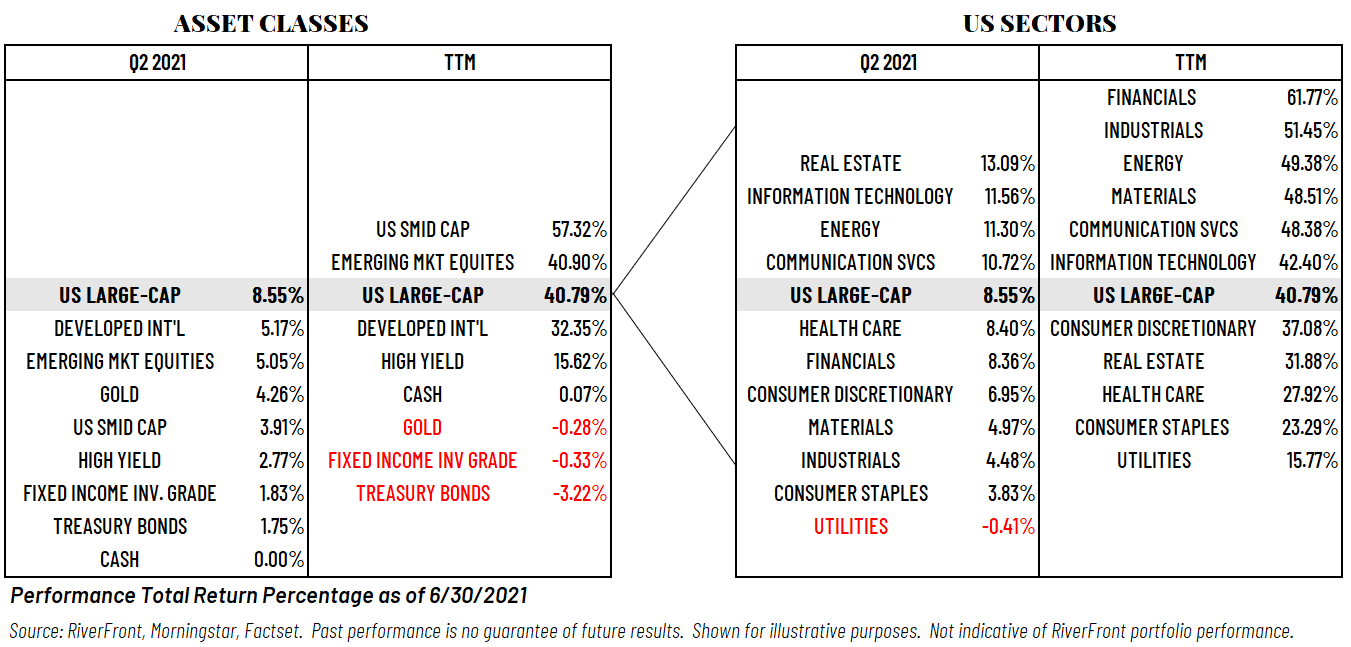
While the best performing sectors over the trailing twelve-month period are those most sensitive to the economic recovery, the returns for the second quarter tell a different story in our opinion. Our GPS analogy about different routes is well-illustrated as the top three performing sectors during the second quarter are each associated with a different theme – inflation, growth, and value. Inflation concerns resulted in the Real Estate sector turning in the best performance, rising to over 13%. The Information Technology sector is the bellwether for growth and was the second-best performing sector during the quarter as investors responded to positive earnings guidance. This sector had the highest number of companies issuing positive earnings and revenue guidance of all eleven S&P 500 sectors during the second quarter. Finally, the value-oriented Energy sector also rose over 11% during the quarter as it continued to benefit from higher oil prices. Oil prices rose to two-year highs in June due to the growing strength in demand.
We believe the uneven nature of the recovery makes the case for diversification and increases the importance of selection as we navigate through the remainder of 2021.
Our current domestic equity selection is characterized by what we refer to as a ‘barbell’ approach, which gives us exposure to both growth and value-oriented equities. Our strategies currently hold a mix of industries that continue to benefit from the work-from-home environment as well as those that stand to benefit from the high levels of government stimulus. We prefer industries such as software, data warehousing, financials, and medical devices within our US equity portion of the portfolios. Our outlook for international stocks remains mixed in the near-term as we watch the increase in COVID-19 cases that could hinder economic recovery in Europe and Japan. COVID-19 containment issues have also caused us to adjust our emerging markets exposure lower. We remain underweight fixed income in our balanced strategies and hold US Treasuries as an equity shock absorber.
Process over Prediction:
For much of the past year, market momentum has been tied to one theme: COVID-19 recovery. Now investor attention is subject to multiple detours in the form of headlines creating concern over issues such as higher inflation or higher taxes. At RiverFront, we remain focused on our process rather than the headlines. We are constructive as we look out through the remainder of the year due to our belief that the fundamental underpinnings for a sustainable economic recovery are in place. However, as we noted in the June 14, 2021, edition of the Weekly View (Three Tactical Rules: Flying with the ‘Fasten Seatbelt’ Sign On), we believe markets could face headwinds this summer. Chief among them may be a downturn in investor sentiment as earnings or economic data disappointments serve to dampen investor enthusiasm in the near-term.
Important Disclosure Information
The comments above refer generally to financial markets and not RiverFront portfolios or any related performance. Opinions expressed are current as of the date shown and are subject to change. Past performance is not indicative of future results and diversification does not ensure a profit or protect against loss. All investments carry some level of risk, including loss of principal. An investment cannot be made directly in an index.
Chartered Financial Analyst is a professional designation given by the CFA Institute (formerly AIMR) that measures the competence and integrity of financial analysts. Candidates are required to pass three levels of exams covering areas such as accounting, economics, ethics, money management and security analysis. Four years of investment/financial career experience are required before one can become a CFA charterholder. Enrollees in the program must hold a bachelor’s degree.
Information or data shown or used in this material was received from sources believed to be reliable, but accuracy is not guaranteed.
This report does not provide recipients with information or advice that is sufficient on which to base an investment decision. This report does not take into account the specific investment objectives, financial situation or need of any particular client and may not be suitable for all types of investors. Recipients should consider the contents of this report as a single factor in making an investment decision. Additional fundamental and other analyses would be required to make an investment decision about any individual security identified in this report.
The Advantage portfolios may be invested in stocks, bonds and exchange-traded products (exchange-traded funds (ETFs) and exchange-traded notes (ETNs)). Advantage is offered through separately managed accounts or on model delivery platforms, depending on the Sponsor Firm.
In a rising interest rate environment, the value of fixed-income securities generally declines.
High-yield securities (including junk bonds) are subject to greater risk of loss of principal and interest, including default risk, than higher-rated securities.
Small-, mid- and micro-cap companies may be hindered as a result of limited resources or less diverse products or services and have therefore historically been more volatile than the stocks of larger, more established companies.
Technology and Internet-related stocks, especially of smaller, less-seasoned companies, tend to be more volatile than the overall market.
When referring to being “overweight” or “underweight” relative to a market or asset class, RiverFront is referring to our current portfolios’ weightings compared to the composite benchmarks for each portfolio. Asset class weighting discussion refers to our Advantage portfolios. For more information on our other portfolios, please visit www.riverfrontig.com or contact your Financial Advisor.
Investing in foreign companies poses additional risks since political and economic events unique to a country or region may affect those markets and their issuers. In addition to such general international risks, the portfolio may also be exposed to currency fluctuation risks and emerging markets risks as described further below.
Changes in the value of foreign currencies compared to the U.S. dollar may affect (positively or negatively) the value of the portfolio’s investments. Such currency movements may occur separately from, and/or in response to, events that do not otherwise affect the value of the security in the issuer’s home country. Also, the value of the portfolio may be influenced by currency exchange control regulations. The currencies of emerging market countries may experience significant declines against the U.S. dollar, and devaluation may occur subsequent to investments in these currencies by the portfolio.
Foreign investments, especially investments in emerging markets, can be riskier and more volatile than investments in the U.S. and are considered speculative and subject to heightened risks in addition to the general risks of investing in non-U.S. securities. Also, inflation and rapid fluctuations in inflation rates have had, and may continue to have, negative effects on the economies and securities markets of certain emerging market countries.
Stocks represent partial ownership of a corporation. If the corporation does well, its value increases, and investors share in the appreciation. However, if it goes bankrupt, or performs poorly, investors can lose their entire initial investment (i.e., the stock price can go to zero). Bonds represent a loan made by an investor to a corporation or government. As such, the investor gets a guaranteed interest rate for a specific period of time and expects to get their original investment back at the end of that time period, along with the interest earned. Investment risk is repayment of the principal (amount invested). In the event of a bankruptcy or other corporate disruption, bonds are senior to stocks. Investors should be aware of these differences prior to investing.
Sectors based on Global Industry Classification Standard (GICS) a standardized classification system for equities developed jointly by Morgan Stanley Capital International (MSCI) and
Standard & Poor’s. The GICS hierarchy begins with 11 sectors and is followed by 24 industry groups, 67 industries, and 147 sub-industries.
Standard & Poor’s (S&P) 500 Index TR USD (US Large Cap) measures the performance of 500 large cap stocks, which together represent about 80% of the total US equities market.
Asset Class Definitions:
S&P 1000 Index TR USD (US SMID Cap) is a combination of the S&P Mid Cap 400 Index TR USD & S&P Small Cap 600 Index TR USD.
MSCI EAFE Index TR USD (Developed International Equities) is an equity index that captures large and mid cap representation across developed market countries around the world, excluding the US and Canada.
MSCI Emerging Markets Index NR USD (Emerging Market Equities) is an equity index that captures large and mid cap representation across 23 emerging markets (EM) countries.
Bloomberg Barclays Capital US Treasury Index TR USD (Treasury Bonds) measures the performance of the US Treasury bond market.
Bloomberg Barclays US Aggregate Bond Index TR USD (Fixed Income Investment Grade) is an unmanaged index that covers the investment grade fixed rate bond market with index components for government and corporate securities, mortgage pass-through securities, and asset-backed securities. The issues must be rated investment grade, be publicly traded, and meet certain maturity and issue size requirements.
ICE BofA Merrill Lynch High Yield Index TR USD (High Yield) which tracks the performance of US dollar denominated below investment grade rated corporate debt publicly issued in the US domestic market. Index constituents are capitalization-weighted based on their current amount outstanding times the market price plus accrued interest.
Bloomberg Barclays Capital 1–3 Month US Treasury Bill Index TR USD (Cash) includes all publicly issued zero-coupon US Treasury Bills with a remaining maturity between 1 and 3 months, are rated investment-grade, and have an outstanding face value of $250 million or more.
LBMA Gold Price PM ($/OZt) (GOLD) – the London gold price per troy ounce of gold for delivery in London through a member of the LBMA authorized to effect such delivery, stated in U.S. Dollars, as calculated and administered by independent service provider (S) and published by the LBMA on its website at www.lbma.org.uk
RiverFront Investment Group, LLC (“RiverFront”), is a registered investment adviser with the Securities and Exchange Commission. Registration as an investment adviser does not imply any level of skill or expertise. Any discussion of specific securities is provided for informational purposes only and should not be deemed as investment advice or a recommendation to buy or sell any individual security mentioned. RiverFront is affiliated with Robert W. Baird & Co. Incorporated (“Baird”), member FINRA/SIPC, from its minority ownership interest in RiverFront. RiverFront is owned primarily by its employees through RiverFront Investment Holding Group, LLC, the holding company for RiverFront. Baird Financial Corporation (BFC) is a minority owner of RiverFront Investment Holding Group, LLC and therefore an indirect owner of RiverFront. BFC is the parent company of Robert W. Baird & Co. Incorporated, a registered broker/dealer and investment adviser.
To review other risks and more information about RiverFront, please visit the website at www.riverfrontig.com and the Form ADV, Part 2A. Copyright ©2021 RiverFront Investment Group. All Rights Reserved. ID 1710528
