
By Rebecca Felton
Summary
- The year finished strong as investors look ahead to a 2021 recovery.
- Previously lagging sectors, such as Energy and Financials, were the best performers, we believe, due to growing expectations for a full re-opening of the economy.
- As the rotation towards recovery plays continues, we have increased our exposure to economically sensitive areas such as emerging markets.
The Road to Recovery is Paved with Government Spending and Vaccine Approvals
Finished the year strong:
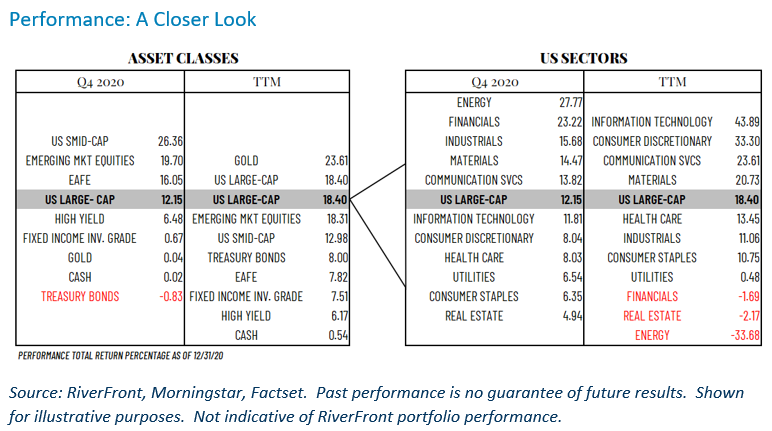
At the beginning of the fourth quarter, uncertainties surrounding the US elections, timing of vaccine approval, and above-average valuation levels left many investors questioning whether the rally off the March lows could be sustained. News of additional stimulus, improving economic metrics, and multiple vaccine approvals overshadowed those uncertainties. As a result, investors chose to focus on the road ahead rather than the rear-view mirror. Ultimately headlines gave way to recovering fundamentals, leading global equities higher. During Q4, the S&P 500 gained 12.15% and made a new high, but global equities also benefitted from regional economic turnarounds as Developed International equities rose 16.05% and Emerging Markets gained even more by increasing 19.70%. As the recovery theme gained traction, US small-cap equities were the best performing equity asset class compared to other major asset classes, rising 26.36% during the period. In a risk-on quarter, it isn’t surprising that fixed income instruments lagged equities. In the table below, the best performing fixed income asset class, Investment Grade Bonds, rose less than 1% in the fourth quarter.
The table below shows the performance of asset classes on the left and US equity sectors on the right. Returns for both the fourth quarter and the past 12 months (TTM) are shown. The table is anchored by US Large-Cap equities, which are shaded, and allows for easier comparison to see higher and lower relative performance by each asset classes and sector.
The laggards became the leaders as investors shifted the focus from quarantine to reopening:
During the last quarter of the year, all eleven sectors in the S&P 500 turned in a positive performance. After the news of vaccine approvals came in November, those sectors and asset classes expected to benefit from the re-opening of the global economy were the strongest performers. Four of the five top-performing sectors during the quarter were cyclical segments of the market that lagged during the height of the pandemic shutdown. While still the worst performing sector over the past year, the Energy sector rose roughly 28% as reopening hopes fueled expectations for a resumption of oil demand. The second-best performing US sector, Financials, rose 23%. Rounding out the top five were Industrials, Materials, and Communications Services.
We are constructive on our outlook for 2021:
In RiverFront’s 2021 Outlook, the Base Case expectation for returns for the S&P 500 is a range of 8%-10%. At the time of this writing, our strategies remain overweight U.S. equities, but we continue to note the increasing attractiveness of international equities as well as their leverage to a falling dollar. Our Tactical Process guides our shorter horizon portfolio decisions. While our most recent analysis of the primary trend, as defined by the 200-day moving average for the S&P 500, is positive, the rate at which the trend is rising is unsustainable in our view. When combined with data suggesting extreme investor optimism, we would not be surprised to see the index move sideways or temporarily retrace some of those gains before moving higher.
We believe diversification and selection will be the keys to success this year:
As the rotation towards economically sensitive stocks continues, we have shifted some of our equity exposure to include a mix of what we believe to be stable earnings growers as well as cyclical stocks. As we move forward, a weaker dollar would likely cause us to continue shifting our strategies to be more levered to segments of the market that we think will benefit such as international equities. Within international, we believe emerging Asian economies will prove more resilient to COVID-19 and thus, have increased our exposure to emerging markets in our longer horizon portfolios.
Originally published by RiverFront Investment Group, 1/11/21
Important Disclosure Information
The comments above refer generally to financial markets and not RiverFront portfolios or any related performance. Opinions expressed are current as of the date shown and are subject to change. Past performance is not indicative of future results and diversification does not ensure a profit or protect against loss. All investments carry some level of risk, including loss of principal. An investment cannot be made directly in an index.
Chartered Financial Analyst is a professional designation given by the CFA Institute (formerly AIMR) that measures the competence and integrity of financial analysts. Candidates are required to pass three levels of exams covering areas such as accounting, economics, ethics, money management and security analysis. Four years of investment/financial career experience are required before one can become a CFA charterholder. Enrollees in the program must hold a bachelor’s degree.
Information or data shown or used in this material was received from sources believed to be reliable, but accuracy is not guaranteed.
This report does not provide recipients with information or advice that is sufficient on which to base an investment decision. This report does not take into account the specific investment objectives, financial situation or need of any particular client and may not be suitable for all types of investors. Recipients should consider the contents of this report as a single factor in making an investment decision. Additional fundamental and other analyses would be required to make an investment decision about any individual security identified in this report.
In a rising interest rate environment, the value of fixed-income securities generally declines.
High Yield Securities High-yield securities (including junk bonds) are subject to greater risk of loss of principal and interest, including default risk, than higher-rated securities.
Small-, mid- and micro-cap companies may be hindered as a result of limited resources or less diverse products or services and have therefore historically been more volatile than the stocks of larger, more established companies.
Technology and Internet-related stocks, especially of smaller, less-seasoned companies, tend to be more volatile than the overall market.
When referring to being “overweight” or “underweight” relative to a market or asset class, RiverFront is referring to our current portfolios’ weightings compared to the composite benchmarks for each portfolio. Asset class weighting discussion refers to our Advantage portfolios. For more information on our other portfolios, please visit www.riverfrontig.com or contact your Financial Advisor.
Investing in foreign companies poses additional risks since political and economic events unique to a country or region may affect those markets and their issuers. In addition to such general international risks, the portfolio may also be exposed to currency fluctuation risks and emerging markets risks as described further below.
Changes in the value of foreign currencies compared to the U.S. dollar may affect (positively or negatively) the value of the portfolio’s investments. Such currency movements may occur separately from, and/or in response to, events that do not otherwise affect the value of the security in the issuer’s home country. Also, the value of the portfolio may be influenced by currency exchange control regulations. The currencies of emerging market countries may experience significant declines against the U.S. dollar, and devaluation may occur subsequent to investments in these currencies by the portfolio.
Foreign investments, especially investments in emerging markets, can be riskier and more volatile than investments in the U.S. and are considered speculative and subject to heightened risks in addition to the general risks of investing in non-U.S. securities. Also, inflation and rapid fluctuations in inflation rates have had, and may continue to have, negative effects on the economies and securities markets of certain emerging market countries.
Stocks represent partial ownership of a corporation. If the corporation does well, its value increases, and investors share in the appreciation. However, if it goes bankrupt, or performs poorly, investors can lose their entire initial investment (i.e., the stock price can go to zero). Bonds represent a loan made by an investor to a corporation or government. As such, the investor gets a guaranteed interest rate for a specific period of time and expects to get their original investment back at the end of that time period, along with the interest earned. Investment risk is repayment of the principal (amount invested). In the event of a bankruptcy or other corporate disruption, bonds are senior to stocks. Investors should be aware of these differences prior to investing.
Sectors based on Global Industry Classification Standard (GICS) a standardized classification system for equities developed jointly by Morgan Stanley Capital International (MSCI) and
Standard & Poor’s. The GICS hierarchy begins with 11 sectors and is followed by 24 industry groups, 67 industries, and 147 sub-industries.
Standard & Poor’s (S&P) 500 Index TR USD (US Large Cap) measures the performance of 500 large cap stocks, which together represent about 80% of the total US equities market.
Asset Class Definitions:
S&P 1000 Index TR USD (US SMID Cap) is a combination of the S&P Mid Cap 400 Index TR USD & S&P Small Cap 600 Index TR USD.
MSCI EAFE Index TR USD (Developed International Equities) is an equity index that captures large and mid cap representation across developed market countries around the world, excluding the US and Canada.
MSCI Emerging Markets Index NR USD (Emerging Market Equities) is an equity index that captures large and mid cap representation across 23 emerging markets (EM) countries.
Bloomberg Barclays Capital US Treasury Index TR USD (Treasury Bonds) measures the performance of the US Treasury bond market.
Bloomberg Barclays US Aggregate Bond Index TR USD (Fixed Income Investment Grade) is an unmanaged index that covers the investment grade fixed rate bond market with index components for government and corporate securities, mortgage pass-through securities, and asset-backed securities. The issues must be rated investment grade, be publicly traded, and meet certain maturity and issue size requirements.
ICE BofA Merrill Lynch High Yield Index TR USD (High Yield) which tracks the performance of US dollar denominated below investment grade rated corporate debt publicly issued in the US domestic market. Index constituents are capitalization-weighted based on their current amount outstanding times the market price plus accrued interest.
Bloomberg Barclays Capital 1–3 Month US Treasury Bill Index TR USD (Cash) includes all publicly issued zero-coupon US Treasury Bills with a remaining maturity between 1 and 3 months, are rated investment-grade, and have an outstanding face value of $250 million or more.
LBMA Gold Price PM ($/OZt) (GOLD) – the London gold price per troy ounce of gold for delivery in London through a member of the LBMA authorized to effect such delivery, stated in U.S. Dollars, as calculated and administered by independent service provider (S) and published by the LBMA on its website at www.lbma.org.uk
RiverFront Investment Group, LLC (“RiverFront”), is a registered investment adviser with the Securities and Exchange Commission. Registration as an investment adviser does not imply any level of skill or expertise. Any discussion of specific securities is provided for informational purposes only and should not be deemed as investment advice or a recommendation to buy or sell any individual security mentioned. RiverFront is affiliated with Robert W. Baird & Co. Incorporated (“Baird”), member FINRA/SIPC, from its minority ownership interest in RiverFront. RiverFront is owned primarily by its employees through RiverFront Investment Holding Group, LLC, the holding company for RiverFront. Baird Financial Corporation (BFC) is a minority owner of RiverFront Investment Holding Group, LLC and therefore an indirect owner of RiverFront. BFC is the parent company of Robert W. Baird & Co. Incorporated, a registered broker/dealer and investment adviser.
To review other risks and more information about RiverFront, please visit the website at www.riverfrontig.com and the Form ADV, Part 2A. Copyright ©2021 RiverFront Investment Group. All Rights Reserved. ID 1474304
