
I never ask if the market is going to go up or down because I don’t know, and besides, it doesn’t matter. I search nation after nation for stocks, asking: ‘Where is the one that is lowest-priced in relation to what I believe it’s worth?’ Forty years of experience have taught me you can make money without ever knowing which way the market is going.
Sir John Templeton [1]
For investors, 2025 has not gotten off to the start that many had envisioned. Many will assume that I’m referring to political turmoil relating to tariffs or spending cuts by the Department of Government Efficiency (DOGE) and the corresponding market spillover. What I’m alluding to is partially related, but it isn’t the point of this article. For the better part of the last decade, investors have grown accustomed to very strong and rather incremental gains from US stocks. In fact, over the past 10 years US stocks have gained 13.6% per year and have risen in 69% of months along the way. Smooth upward progress has been the theme, aside from some short-lived hiccups.
During this time, US large cap stocks have left all other assets comfortably in their rear-view mirror. At the same time, non-US stocks have gained just 6.51% in dollar terms and 7.04% in local terms. Ironically, we can call this just mediocre performance by international equities, but excluding style segments, only US small cap performed better than international stocks, gaining 7.12%. If we extend the analysis to include styles, US large growth was the king at 17.01% per year, followed by US large value at a distant 9.19% per year, both of course components of the greater US large cap category. Everything else fell short. This truly was a decade of dominance for US large growth stocks, with everything else producing mid-single digit results at best.
A Decade of Dominance
Thus far, US markets have gotten off to a volatile first half of 2025, declining by as much as 19% from their peak before rebounding to advance 6% through the end of June. This pales in comparison to the near 23% gain for international value stocks and falls short of the 9% gain for emerging markets value stocks and is the consequence of a series of events that have occurred during the last 10-15 years. First, for US markets, not all this performance over the last decade was truly organic. Or said differently, it wasn’t earnings growth generated performance, the truly sustainable source of return. It is accurate to say that earnings expanded greatly during this time, growing from $97 per share to $216 per share. This was good for a very solid 8.27% annualized growth rate. For perspective, real earnings grew about 5% per year…. more than double the historical average long-term growth rate. This was a stellar period for US earnings, as it should have been, given the confluence of ultra-low rates and excess fiscal stimulus. Add a dividend yield of about 1.73% and you have legitimate sustainable returns at roughly 10% annualized.
Now, here’s where the real magic occurred…all explainable, but sleight of hand, nonetheless. The valuation multiple, the price that an investor pays for a dollar’s worth of earnings, moved from 20x to 27x…a 35% move in total, good for an additional 3% annualized rate of return. Simply stated, investors are now willing to pay 35% more for the same dollar of earnings than they did a decade ago. Combine this with the 10% from earnings and dividends and you get an annualized return of about 13%, well within a margin of error from the actual return I quoted earlier in the article. Now, the so-called sleight of hand… the expansion of the valuation multiple…was completely explainable and justifiable under the circumstances, but is completely unsustainable looking forward. To duplicate those results from expanding valuations, the multiple would need to end the next decade at 33x, about double its historical average.
Now, non-US developed markets, as well as emerging markets are a bit of a contrast. Over the last decade, international value stocks saw earnings move from $137 to $222, a 4.9% nominal growth rate or 1.9% in inflation adjusted terms, in-line with what long-term growth of real earnings should be for developed economies on a sustainable basis. The dividend was higher than the US, 4.23% on average, leaving you with a sustainable return of 9.13%, just 0.87% less than what we saw out of the US.
Now, for the magic… there are two parts for non-US assets. First the multiple moved down from 15.46x to 12.01x, subtracting 2.49% per year and leaving investors with a 6.64% total return, in local currency terms. In addition, the dollar strengthened against the local basket of currencies by just over 10%, which in annualized terms subtracts 0.60%, leaving an annualized return for the decade of 6.05% per year. For emerging value, it was the same story, only a bit worse, with an annualized return of 4.01%. Same drivers…multiple contraction and a strong US dollar laying waste to results.
The Case for Non-US Stocks
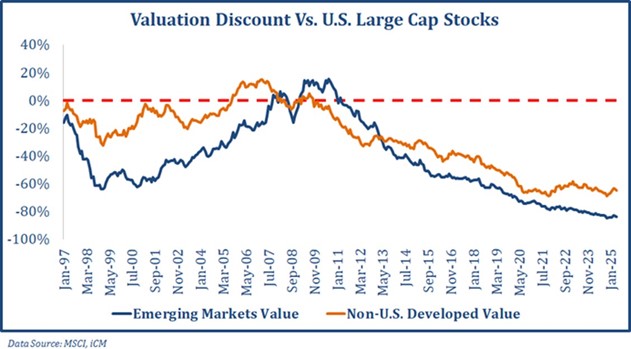
The case for non-US stocks, value in particular, is anchored by especially strong fundamentals. This case can be made on its own or in comparison to US stocks, which makes it even more compelling. Let’s take one of our favorite valuation metrics, price-to-trendline earnings. Why is it one of our favorites? Along with others like the various Shiller CAPE methodologies, using trendline earnings, much like the multi-period earnings used in the Shiller CAPE ratio, takes the cyclicality out of the valuation ratio. A traditional PE ratio of 20x based on cyclically high earnings will produce a drastically different return going forward than that same 20x PE ratio based on cyclically depressed earnings.
Both the Shiller methodology and price-to-trendline earnings give you a clearer view, yet trendline has two main advantages. First, you can work with shorter data sets. A Shiller CAPE needs a minimum of 10 years of earnings to produce one data point. Then you need multiple data points to be able to draw a conclusion. Price-to-trendline earnings can work with as short of an earnings series as you have confidence in the trend. Second, Shiller CAPE ratios can get trapped within their own definition. What do I mean by this? It is not only possible, but probable, that you’ll run into an entire 10-year period where earnings are riding a cyclical high or low. We’ve lived in one for probably the last 30 years. This distorts the valuation. With price/trend earnings, the trend is more stable, producing a stronger and more reliable estimate of future returns than the standard Shiller CAPE ratio, and much stronger estimate than any conventional method like a TTM PE or forward PE. This is born out in the higher adjusted r-squared of price-to-trend vs. many of the other metrics.
Based on this metric, non-US developed value stocks are now 30% undervalued relative to their own history. Combine this with an undervalued basket of currencies relative to the dollar, and the opportunity presented to investors is a 40%+ discount to historical fundamentals, including the currency. For emerging value, this discount is about twice that, at approximately 80%, a near-historic opportunity in emerging value stocks.
Now the argument supporting both non-US developed, and emerging markets stocks becomes truly compelling when you compare both to the US. From just a valuation perspective non-US developed value stocks trade at a 67% discount to the US (not including the currency) while emerging value trades at an eye popping 84% discount to the US. To make this a bit more concrete, the US currently trades at nearly 41x price-to- trend earnings, while emerging markets value stocks trade at 6x price-to-trend earnings!
That said, inexpensive valuations are only party of the equation… admittedly a big part, but only a part. You see, a cheap stock, or asset class, is like a coiled spring. There’s all this stored energy that has the immense potential to be turned into kinetic energy as the spring uncoils. But, it needs a catalyst. I’m going to present three catalysts that have emerged recently to support this notion.
- Government spending has been a significant tailwind to US markets since the financial crisis. As the world’s reserve currency, deficit spending is a bit of a requirement, as the US needs to produce a reliable stream of treasuries as the storage receptacle for all those reserve currency dollars. As a result, the benefit to the US is typically low interest rates and a tailwind to GDP because of all the extra spending from the treasury proceeds. The downside is that it produces a strong currency, which hurts US manufacturing.
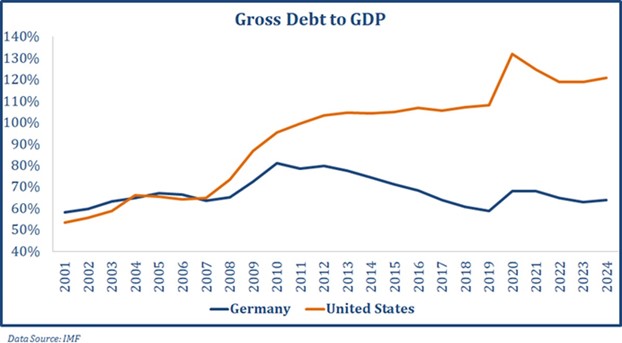
Chart 1
Currently, the US has borrowed its way to a national debt level that is 120% of annual GDP. This compares to Europe at about 90%, and Germany at about 60%. Moody’s recently downgraded US debt because of this, causing many to believe that we are at or near our spending limit. In typical years, the US spends at a deficit level of about 3% of GDP. In recent years this has ballooned to as much as 6%. So, for the US, we are fast approaching our credit limit, and the pendulum has swung toward a bit of austerity. By contrast, let’s take Germany as an example. Earlier this year, Germany announced a trillion-dollar domestic spending program along with increases in defense spending to align with NATO required spending levels. Combine this with ample ability to borrow and you can see a catalyst emerge… additional fiscal support for non-US markets, which has the potential to bolster growth, much like the US has experienced for the past decade.
Chart 2
- The second catalyst is a bit more straight forward. Earnings within the US came into 2025 with very lofty expectations of 20% growth for the calendar year, an unrealistic number. This has been continually revised lower as the year has By contrast, non-US earnings, which have struggled in recent years have begun to rebound and have proven much more resilient than their US counterparts. This serves as a second potential catalyst…positive earnings momentum in non-US assets.
Chart 3
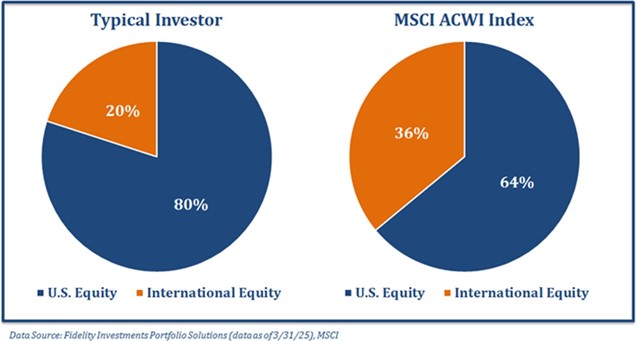
- Our third and final catalyst relates to the potential for investors to make additional allocations to non-US The global cap-weighed allocation, the only true passive portfolio for investors, should include an allocation of 38% to international stocks, 11pts of which is allocated to emerging markets. The average investor only allocates 23% in total to non-US holdings, a large underweight to non-us equities, which is largely due to the long string of outperformance by US stocks. But that pendulum is swinging.
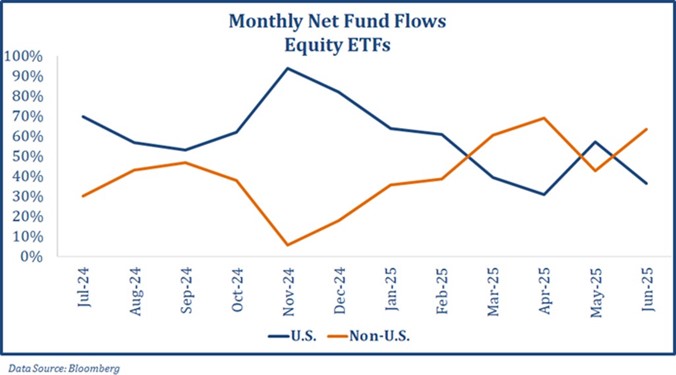
If we look at fund flows, peak flows into the US-focused funds were $204B in Dec 2024. By contrast, international flows were just $50B. The peak, on a percentage basis, was one month earlier with the US taking in $0.88 of every dollar. This changed in or around March with about a 50/50 split over the next three months. Then in June, it was very one- sided, with non-us equities taking in $0.60 on the dollar, a reversal of sorts. It appears investors may be coming around to the idea of more international, our third catalyst, the potential for investors to reallocate a larger share to international holdings.
Chart 4
Summary
In summary, while US stocks have been strong performers inthe past, there are compelling reasons to consider investing in non-US stocks right now. These include potentially better value, stronger earnings growth, portfolio diversification, and favorable macroeconomic trends outside the
U.S. Recent performance has also swung decidedly in favor of non-US holdings, as non-US value stocks have gained 23% to start the year while emerging value stocks have gained 9%. Both are key positions within our strategies. While only time will tell if this is truly green shoots for non-US markets or just another head fake, it does beg the question if US dominance has reached its summit and if we are truly witnessing the End of an Era. Thank you as always for your continued trust and confidence.
By Michael Paciotti, CFA
Originally published by Integrated Capital Management
For more news, information, and strategy, visit the ETF Strategist Content Hub.
[1] Sir John Marks Templeton was an American-born British investor, banker, fund manager, and philanthropist. In 1954, he entered the mutual fund market and created the Templeton Growth Fund, which averaged growth over 15% per year for 38 years. A pioneer of emerging market investing in the 1960s, Money magazine named him “arguably the greatest global stock picker of the century” in 1999. – Life Story – The John Templeton Foundation, William Greene (1999). The Secrets of Sir John Templeton (January 1, 1999). CNN Money accessed 29 August 2020, Lauren Templeton and Scott Phillips (2008). Investing the Templeton Way: The Market-Beating Strategies of Value Investing’s Legendary Bargain Hunter. McGraw Hill Education
All data as of 6/30/2025 unless otherwise noted.
Market Insights is intended solely to report on various investment views held by Integrated Capital Management, an institutional research and asset management firm, is distributed for informational and educational purposes only and is not intended to constitute legal, tax, accounting or investment advice. Opinions, estimates, forecasts, and statements of financial market trends that are based on current market conditions constitute our judgment and are subject to change without notice. Integrated Capital Management does not have any obligation to provide revised opinions in the event of changed circumstances. We believe the information provided here is reliable but should not be assumed to be accurate or complete. References to specific securities, asset classes and financial markets are for illustrative purposes only and do not constitute a solicitation, offer or recommendation to purchase or sell a security. Past performance is no guarantee of future results. All investment strategies and investments involve risk of loss and nothing within this report should be construed as a guarantee of any specific outcome or profit. Investors should make their own investment decisions based on their specific investment objectives and financial circumstances and are encouraged to seek professional advice before making any decisions. Index performance does not reflect the deduction of any fees and expenses, and if deducted, performance would be reduced. Indexes are unmanaged and investors are not able to invest directly into any index. (MMXXV-II)
