
By Rod Smyth, Chairman of the Board of Directors
SUMMARY
- The market’s rise has been justified by strong fundamentals, in our view.
- We expect continued growth in earnings and remain bullish on stocks.
- We believe investors should prepare themselves for the inevitable corrections that will come.
If Delta Couldn’t Stop the Stock Market’s Remarkable Performance, Omicron Likely Won’t Either
The last three years have been truly remarkable for all of us, here’s what it has meant for US stocks:
- The S&P 500 has risen 81% since January 2019, delivering gains of 29%, 16%, and 21% (YTD) respectively in each of the last three years.
- In the last year alone, it rose to over 40% from its low last October to the recent high (see chart below).
- The 200-day moving average (our favorite gauge of the long-term moving average) barely declined in the first quarter of 2020 because the recovery was so rapid and is now rising at an annualized rate of 27%.
- All of this occurred, despite a devastating worldwide pandemic that caused the worst global recession since the Great Depression; and continues with the new Omicron variant.
While we believe the pace of the market’s advance is not sustainable over the next 12 months, we think such strong momentum is a bullish indicator, reflecting the magnitude of the rebound in the economy and earnings. In the chart below we have highlighted levels of technical support, one of which is around current levels. Should fears about Omicron’s economic impact escalate, we see further support between 4,300 and 4,400.
Chart 1: An Exceptional 12 Months
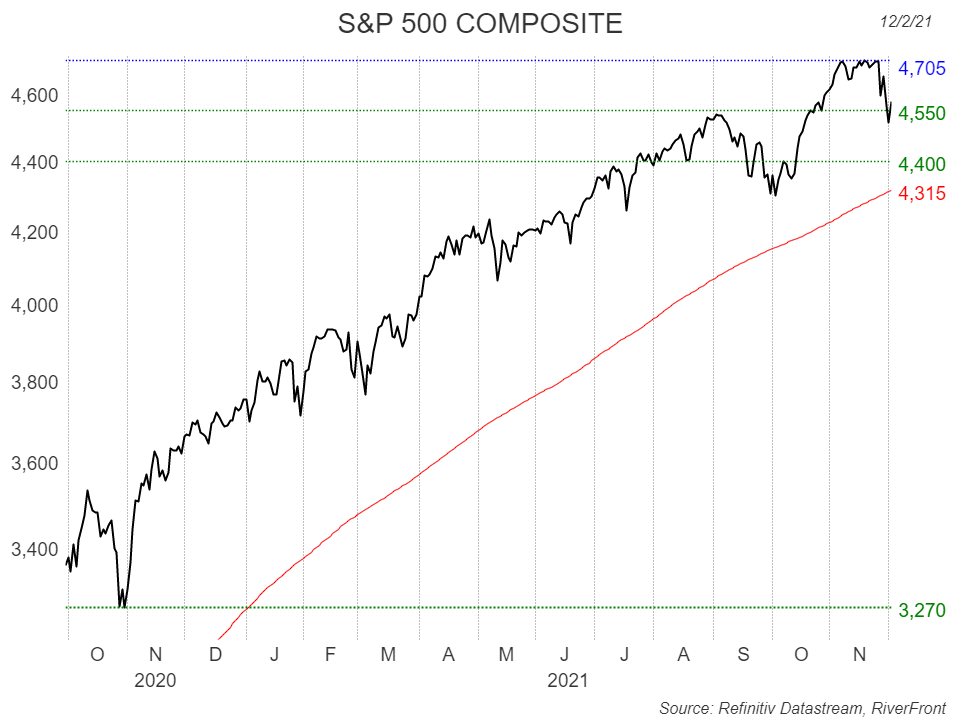
Shown for illustrative purposes. Not indicative of RiverFront portfolio performance.
The size of the market’s rebound caught many by surprise. Given the scale of the pandemic, with its multiple waves and variants, it is safe to say that few would have foreseen the magnitude of the recovery in stock prices, profits, and profit margins. If ever there was a case for our mantra of ‘Process over Prediction’, this has been it.
Credit for this outcome can be given to a huge fiscal response, massive monetary intervention, and exceptional corporate management. The US was a roughly $22T economy and it lost about one tenth of its value or $2T during the recession. As you can see this was a significantly greater decline than the 2008 recession.
Chart 2: GDP in Record Territory Despite Continued Pandemic

Shown for illustrative purposes. Not indicative of RiverFront portfolio performance.
To offset the loss of demand and jobs, the Federal Government passed six spending bills totaling over $5T and the Federal Reserve increased its balance sheet by nearly $4.5T since March 2020. By any standards this was a “shock and awe” response and has led to the strength of the subsequent recovery, in our view.
S&P 500 companies managed their costs effectively, so earnings and margins have soared to record levels as shown in chart 3 below. This is an extraordinary feat and goes a long way to explaining the market’s advance.
Chart 3: Earnings and Profit Margins Well Above Pre-Pandemic Levels
Shown for illustrative purposes. Not indicative of RiverFront portfolio performance.
Pace of earnings to slow down. Markets tend to react to news at the margin, and the news on the economy and especially on earnings, has consistently surprised to the upside. Consensus 2021 earnings for the S&P 500 started the year around $165 and are now over $200 (source: Standard & Poors). In our view, that kind of earnings surprise is very unlikely in 2022 with margins having already roared to record levels. Furthermore, we expect the Federal Reserve to gradually reduce the size of its balance sheet and we think, given the challenge of agreeing on the current spending bill before Congress, whatever spending bill is passed is likely to be the last for quite a long time.
The emergence of Omicron. It has been depressing to learn of another variant of COVID-19. No one can know what the impact of further strains will be, hence the global stock market sell-off. What we do know is this:
- The drug industry has been very innovative in producing vaccines and now anti-virals with plans for tackling this variant. Indeed, Pfizer and BioNTech recently announced that their joint mRNA vaccine against COVID-19 could be tweaked within 100 days specifically to counter Omicron.
- Americans have largely decided whether they want to get vaccinated or not. Thus, the spending habits of the last 6-9 months seem unlikely to change materially.
- Despite the arrival of the more contagious Delta variant, the S&P 500 continued to rise with only limited setbacks. We do not think the reaction to Omicron will be significantly different.
- Should this variant have more serious economic effects, we expect Fed policy to become more accommodative again.
The importance of risk management and mental preparation. Sustain and Distribute investors tend to own more stocks these days due to the very low yields on bonds. This leads to more volatility and potentially bigger drawdowns in their portfolios. As discussed earlier, we do not anticipate another significant bear market as occurred in 2020. At that time, COVID-19 was a complete surprise whereas now it is dealing with a largely known entity and has developed the tools to help mitigate the consequences.
With the 200-day moving average around 4,300, 5.5% below last Friday’s closing level, investors should not be surprised by a continued correction to this rising moving average (see chart 1). This is not a forecast, just a recognition of how far stocks are above their own trend. At RiverFront, we have risk management measures as part of our process, but we think it is also important for investors to prepare themselves mentally and emotionally for the corrections that are part of the journey of a stock investor.
Important Disclosure Information
The comments above refer generally to financial markets and not RiverFront portfolios or any related performance. Opinions expressed are current as of the date shown and are subject to change. Past performance is not indicative of future results and diversification does not ensure a profit or protect against loss. All investments carry some level of risk, including loss of principal. An investment cannot be made directly in an index.
Chartered Financial Analyst is a professional designation given by the CFA Institute (formerly AIMR) that measures the competence and integrity of financial analysts. Candidates are required to pass three levels of exams covering areas such as accounting, economics, ethics, money management and security analysis. Four years of investment/financial career experience are required before one can become a CFA charterholder. Enrollees in the program must hold a bachelor’s degree.
Information or data shown or used in this material was received from sources believed to be reliable, but accuracy is not guaranteed.
This report does not provide recipients with information or advice that is sufficient on which to base an investment decision. This report does not take into account the specific investment objectives, financial situation or need of any particular client and may not be suitable for all types of investors. Recipients should consider the contents of this report as a single factor in making an investment decision. Additional fundamental and other analyses would be required to make an investment decision about any individual security identified in this report.
Gross domestic product (GDP) is the total monetary or market value of all the finished goods and services produced within a country’s borders in a specific time period. As a broad measure of overall domestic production, it functions as a comprehensive scorecard of a given country’s economic health.
The 200-day moving average is a popular technical indicator which investors use to analyze price trends. It is simply a security’s average closing price over the last 200 days.
Index Definitions:
Standard & Poor’s (S&P) 500 Index TR USD (Large Cap) measures the performance of 500 large cap stocks, which together represent about 80% of the total US equities market.
For each outcome category (accumulate, sustain and distribute) RiverFront’s portfolio management team has assigned one or more RiverFront product(s) based on their assessment of the product’s investment objective as it relates to a typical client’s return and risk objectives when seeking investment outcomes of accumulating wealth, sustaining wealth and distributing wealth. The team has also designated RiverFront product alternatives for those clients looking to take more or less risk with the outcome category. The ‘more aggressive’ (or more risk) alternatives will generally have greater equity and international exposure as well as longer time horizon targets, while those designated as ‘more conservative’ (or less risk) will have fewer equities, a lower exposure to international and shorter time horizon targets. Since the risk assessments are dependent on the outcome category selected, RiverFront products may fall in multiple categories. All investments carry a risk of loss and there is no guarantee that an investment product or strategy will meet its stated objectives.
Stocks represent partial ownership of a corporation. If the corporation does well, its value increases, and investors share in the appreciation. However, if it goes bankrupt, or performs poorly, investors can lose their entire initial investment (i.e., the stock price can go to zero). Bonds represent a loan made by an investor to a corporation or government. As such, the investor gets a guaranteed interest rate for a specific period of time and expects to get their original investment back at the end of that time period, along with the interest earned. Investment risk is repayment of the principal (amount invested). In the event of a bankruptcy or other corporate disruption, bonds are senior to stocks. Investors should be aware of these differences prior to investing.
Technical analysis is based on the study of historical price movements and past trend patterns. There are no assurances that movements or trends can or will be duplicated in the future.
RiverFront Investment Group, LLC (“RiverFront”), is a registered investment adviser with the Securities and Exchange Commission. Registration as an investment adviser does not imply any level of skill or expertise. Any discussion of specific securities is provided for informational purposes only and should not be deemed as investment advice or a recommendation to buy or sell any individual security mentioned. RiverFront is affiliated with Robert W. Baird & Co. Incorporated (“Baird”), member FINRA/SIPC, from its minority ownership interest in RiverFront. RiverFront is owned primarily by its employees through RiverFront Investment Holding Group, LLC, the holding company for RiverFront. Baird Financial Corporation (BFC) is a minority owner of RiverFront Investment Holding Group, LLC and therefore an indirect owner of RiverFront. BFC is the parent company of Robert W. Baird & Co. Incorporated, a registered broker/dealer and investment adviser.
To review other risks and more information about RiverFront, please visit the website at www.riverfrontig.com and the Form ADV, Part 2A. Copyright ©2021 RiverFront Investment Group. All Rights Reserved. ID 1946799
