
Economic Overview
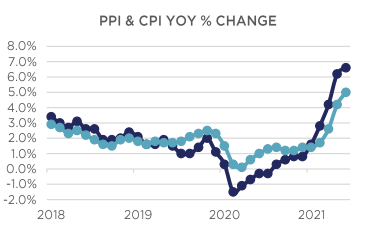
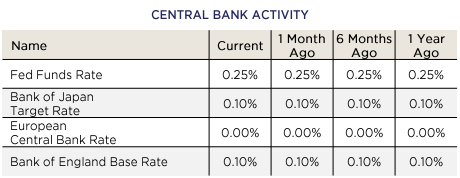
Inflation remains the big story at the halfway point of 2021, as the base-effect impact of Q2 data wanes briefly before likely resuming in late Q3. The Fed’s insistence that the broad-based rise in prices is “transitory” has kept equity markets calm and bond yields subdued. Should the Fed prove to be incorrect, we could see a dramatic re-rating of risk assets by year-end.
Headline CPI for May rose +0.6% MoM and +5.0% YoY (the “base-effect” referring to the period a year ago when the economy was largely shut down and prices were falling), while producer prices edged up +0.8% MoM in May and +6.6% YoY. Within the PPI number, grain prices surged +25.7% on the month, metals were up +6.9%, and beef and veal prices rose +10.5%. We have started to see a decline in some input costs as lumber is off nearly 40% from its recent high. The PCE Deflator rose +0.4% MoM and is up +3.9% YoY.
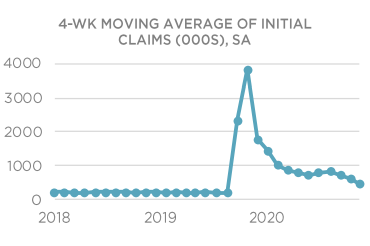
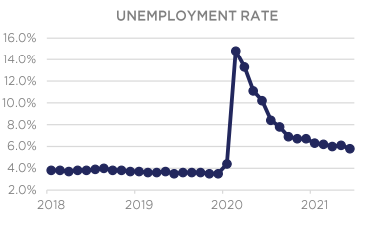
Despite this rise in prices, the Fed remains focused on employment. The June report for May showed +559k new jobs created and a 5.8% unemployment rate. Chair Powell has insisted he would like to see that rate get closer to pre-pandemic levels of sub-4% before potentially tightening monetary policy. Average Hourly Earnings rose +0.5% in May and are up +2.0% YoY. Rising wages continue to be the story as employers try and coax workers off of enhanced unemployment benefits and back into the labor force.
With the Fed’s dual mandate heretofore being to promote stable prices in the context of full employment, this shift to targeting inflation levels (+2%) and unemployment rates has forced a reconsideration of the Fed’s mission and invited speculation as to its political independence. Time will tell if this current bout of inflation is truly temporal, but all eyes will be focused on August’s Jackson Hole confab for more clues as to the Fed’s current targets and plans for a possible unwind.


Domestic Equity
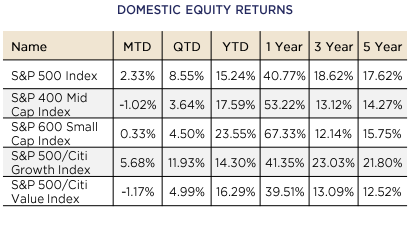
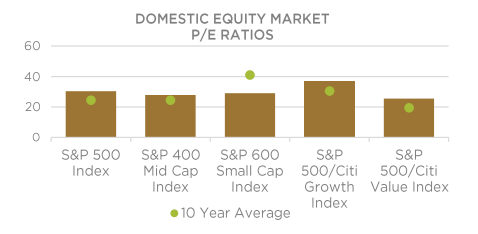
US Equities finished the month of June on a relatively high note, with the benchmark S&P 500 Index gaining +2.33% on the month, after notching its 34th record high of the year on Wednesday. The Index closed at 4,297, up +15.24% for the year. Small- and Mid-Caps, as measured by the S&P 600 and S&P 400 Indices, returned +0.33% and -1.02%, respectively on the month. On a year-to-date basis, Small- and Mid-Caps continue to outpace Large-Caps, having returned +23.55% and +17.59% respectively on the year.
For the quarter, the S&P 500, S&P 400, and S&P 600 returned +8.55%, +3.64%, and +4.51%, respectively.
At the sector level, Mega-Cap Technology companies were back in vogue, with Technology (Apple, Microsoft) and Communications (Alphabet, Facebook) sectors gaining +6.95% and +2.72%, respectively on the month, and +11.56% and +10.32% on the quarter. Both Microsoft and Facebook made headlines as the former became the second company to eclipse a $2 Trillion market value (next to Apple) and the latter escaped a Federal Trade Commission (FTC) inquiry seemingly unscathed, propelling it above $1 Trillion in market capitalization. The resurgence of Big Tech helped propel Growth stocks (+5.68%), as measured by the S&P 500 Growth Index, over Value stocks (-1.17%), as measured by the S&P 500 Value Index by 685bps. Positive company news, coupled with falling interest rates served as a strong prescription for outperformance; however, despite this near term outperformance, the Top 5 companies in the S&P 500 account for less (22%) of the index than they did mid-Summer 2020 (24%) showcasing the strength of “smaller” companies since re-opening started to take hold. Laggards during the month included cyclical, with Materials, Financials, and Industrials giving back -5.30%, -2.96%, and -2.21%, respectively as the Fed Chair Powell sounded a more hawkish tone.
In other news, all 23 Banks subject to the Federal Reserve’s CCAR stress tests passed, and most major banks announced dividend and large-scale share buyback operations, which bodes may bode well for Financials in the back half of the year, despite a flatter yield curve than a month and quarter ago. The benchmark 10-Year Treasury yield closed the month yielding 1.46%, down from 1.58% last month, and 1.73% at the end of the first quarter.


International Equity
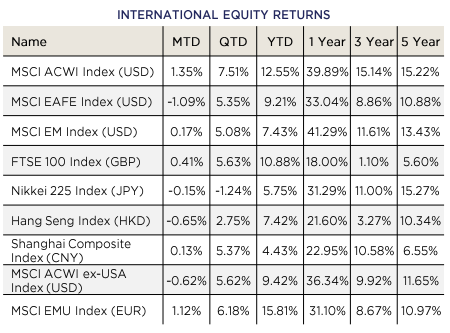
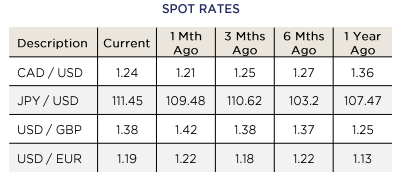
International Equities faced continued headwinds in June as positive news on the vaccination front in Developed Markets (DM) was offset by US dollar strength and Chinese economic data weakness in Emerging Markets (EM). DM equities, as measured by the MSCI EAFE Index, returned -1.25% in June, compared with a +0.17% return for EM equities, as measured by the MSCI EM Index. Eurozone equities, as measured by the MSCI EMU Index, posted positive returns as well, gaining +1.12% on the month.
For the quarter, international equities posted positive returns, with DM, EM, and Eurozone equities posting returns of +5.35%, +5.08%, and +6.18%, respectively.
From a country standpoint, Japanese equities, as measured by the Nikkei 225 Index returned -0.15% in JPY terms on the month. Chinese equities, as measured by the Shanghai Composite returned +0.13% in CNY terms, suffering from slowing economic data, an increase in covid cases, and a weaker Yuan. A flood of Chinese IPOs launched in June, with a significant number of primary and secondary listings in Hong Kong, but most notably Chinese ride-sharing giant DiDi in the US. DiDi has a dominant 80% share in China, and closed its first day of trading with a market cap of $68B, compared to $94B for Uber and $20B for Lyft. From an EM standpoint, MSCI EM ex-China has returned +11.06% year to date, compared to +7.45% for MSCI EM, highlighting the relative drag that China has been on EM as a whole given its outperformance in 2020.
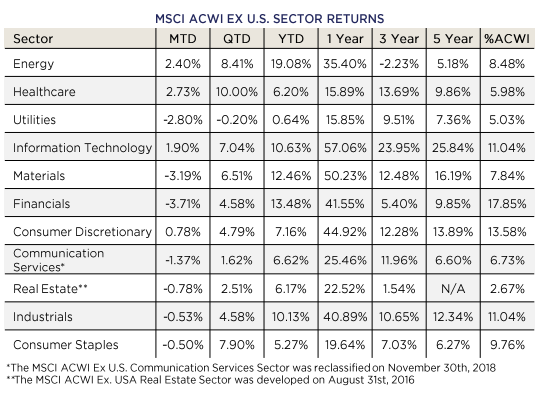
At the sector level, the top-performing International sectors included Energy, Healthcare, and Technology, which returned +2.40%, +2.73%, and 1.90%, respectively on the month. For the quarter the top-performing sector was Healthcare (+10.00%) and the worst performer was Utilities (-0.20%).
Moving forward, the reopening trade should continue to make progress, with increased vaccinations and economic activity; however, recent strength in the U.S. Dollar remains a key headwind. Despite recent Dollar strength, as sentiment internationally improves, recent trends may reverse, providing a tailwind for both DM and EM equities relative to U.S. equities in the second half of the year. Further momentum could ensue should the Delta variant remain contained and vaccination trends in EM specifically turn the corner, as international markets as a whole are likely to trend on sentiment over fundamentals in the near term until Jackson Hole in August.


Fixed Income
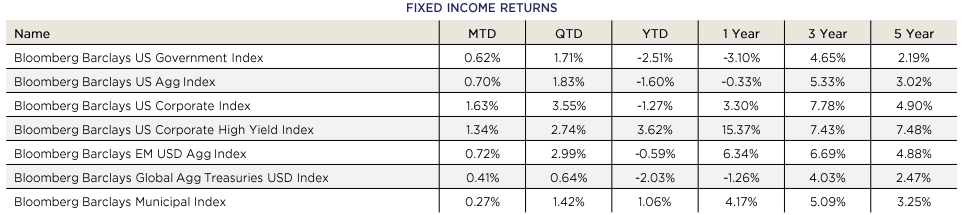
June bond market news was dominated by two pieces of data, the inflation (CPI) reading that came out on June 10th at the highest level in over a decade, and the Federal Reserve’s reaction to it after their meeting on June 16th. Inflation has been rising quicker than expected, with some of the rise attributable to base effects (measuring the increase from pandemic lows). Members of the Fed have admitted that they underestimated the rise. As their eyes have been opened by the data, they have updated their expectations for future policy tweaks. The Fed meets again on July 28th, but any major announcement may be held until their annual conference in Jackson Hole, August 26th-28th.
These policy updates include beginning to talk about asset purchase tapering (reduce/end Quantitative Easing – QE) and raising interest rates sooner than previously projected. The market reaction to these adjustments was swift. Treasury bonds maturing in less than 7 years saw their yields rise, while longer-maturity Treasury bond yields declined. The pivot or twist in the yield curve acknowledged the Fed’s influence on short-term interest rates while expressing doubt in its ability to raise rates without hurting economic growth.
No growth concerns are showing in the credit markets. Investment Grade (IG) bonds have performed well, with their spreads tightening further. Current valuations are a bit pricey but should be fairly durable as economic strength continues.
High Yield (HY) bond spreads also tightened. On a historical basis, they do appear expensive, but again, as long as the economy is running strong, there is no immediate impetus for spreads to move wider. Should growth/stimulus begin to wane, the riskiest parts of the bond market will likely become a volatile space.
Municipal bonds remain in high demand, keeping yield ratios at the lower end of historical valuations. Credit risk in this market has declined as the economy (and tax revenue) comes back online. The Federal Government’s cash infusion into State and Local governments has left many flush with cash. Credit Rating agencies have acknowledged the improvement with rating upgrades and more positive outlooks.
Treasury bonds have benefited from falling yields on longer maturities, pushing prices higher. If inflation proves to be transitory and economic growth fades, current levels may be sensible. This is the scenario the market is currently pricing in. The CPI readings released on July 13th and August 11th should offer additional visibility.


Alternative Investments
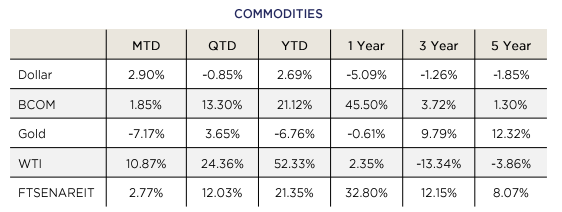
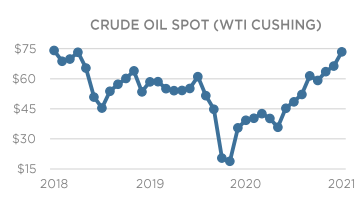
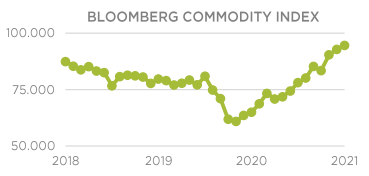
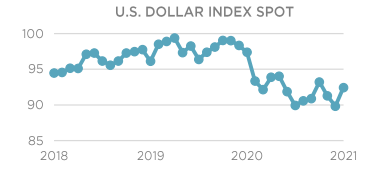
Alternative Investments were mixed in June, with the US Dollar finishing strong. The US Dollar as measured by the DXY Index concluded in June at +2.90% was helped by a seemingly hawkish turn by the Fed. Commodities, as measure by the Bloomberg Barclays Commodity Index, were up +1.85% for the month. Energy, which is the largest component of the index, directed commodities higher despite some weakness by precious and industrial metals. WTI Crude Oil rose +10.78% during the month as crude oil inventories continued to decline.
Lumber was one of the standout performers during the pandemic as a red-hot housing market and limited lumber supply caused a huge run-up in price through May. However, lumber finished June at $737.40 per thousand board feet, down over 50% from its high of over $1,500 per thousand board feet set just over a month ago. Production is finally catching up to demand and people may start to be favoring vacations over home renovation.
During mid-June, China announced that it would release government stockpiles of industrial metals to combat shortages and high metal prices. China will specifically target copper, aluminum, zinc, and some other metals in efforts to keep commodity prices stable. Copper, in particular, finished the month at $4.29 per pound, down from its high of $4.75 per pound in May.
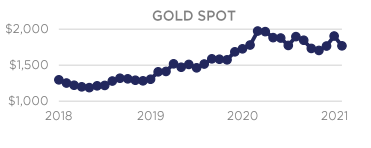
Gold was another laggard in the alternatives space, finishing down -7.17% for the month and erasing all gains from May. The most recent Fed meeting lead to a stronger US Dollar and set-up for potentially higher real rates, thus putting downward pressure on gold prices.
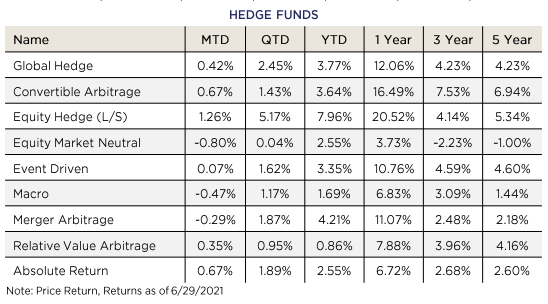
Hedge Fund strategies were mostly positive during the month, with six out of nine strategies tracked posting positive returns on average. Equity Hedge (Long/Short) strategies were the top performer, up +1.26% on the month, and remain the top performer for the year up +7.96%. Equity Market Neutral strategies were the worst performer, down -0.80% for the month.
ESG
The month of June delivered mixed results for the ESG integrated strategies. While they held their ground overall, there was a bit of performance giveback in a few of the strategies.
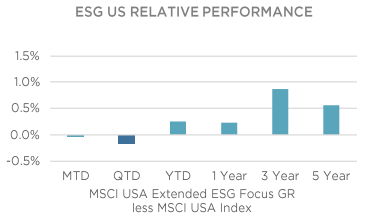
The ESG aligned U.S. index was close to flat compared to the non-ESG integrated counterpart. The two shortest periods reflect some lag, but Year-to-Date and all longer periods continue to show strong outperformance.
ESG integrated EAFE returns have been more mixed than the U.S. or Emerging Markets. All three shorter-term results are trailing, along with the 5-year number, but 1 and 3-year performance has been additive vs. non-integrated exposure.
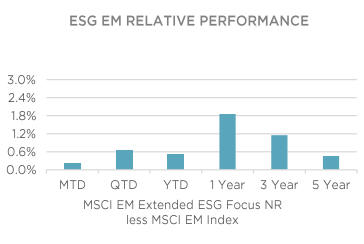
Emerging Market ESG integrated returns posted another gain vs. the benchmark in June. ESG integration remains additive to performance across all periods in EM. This allocation continues to stand out as a shining example of how ESG considerations can lead to better outcomes over time.
Investment Grade corporate bonds have continued to post outperformance due to ESG integration. The ESG integrated fixed income exposure returns are correlated with the non-ESG index, as they will have similar duration and credit characteristics, allowing them to move together directionally. Security selection appears to be giving ESG integration a durable edge. Avoiding bad investments in fixed income is key, in an asset class with such an asymmetric return profile. The risk management properties of monitoring ESG exposures help with this.
Engine No. 1, an activist investment shop which became an overnight sensation in the Responsible Investing world this year by winning three board seats in a Proxy battle with Exxon (while only owning 0.02% of the stock outstanding), has launched their first ETF. This fund will give Engine No. 1 an ownership stake in the 500 largest U.S. companies, which they will use to agitate for positive change (impact), with the expectation that the changes for good can also be financially beneficial to the company implementing the change.


Originally published by Nottingham Advisors
