
Economic data at the beginning of 2021 continued to be skewed by the ongoing pandemic, with regional state-specific shutdowns impacting employment, retail sales and the travel and leisure space in general. The promise of wide-spread vaccinations has yet to be realized, with the rollout hurt by logistical challenges and a shortage of doses. Despite this, estimates remain for a strong rebound in GDP in the second half of 2021, with growth estimates ranging 5% to 7%.
One area that remains hot is housing. Although the data tends to lag by a month or more, the pandemic induced flight from large urban areas to suburbia continues to gain momentum, especially among the large millennial cohort. Housing Starts for December surged +5.8% MoM, while Building Permits rose +4.5% versus November. The S&P CoreLogic 20-City Home Price Index rose +1.42% MoM in November and is up +9.08% YoY.

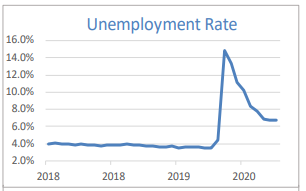
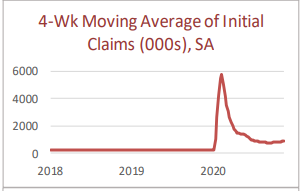
The Labor Market remains impacted by the rolling shutdowns, especially in populous states like New York and California. New York’s Unemployment Rate in December came in at +8.2% while California hit 8.8%, relative to the national rate of 6.7%. Nationally, Average Hourly Earnings continue to tick higher, gaining +0.8% MoM in December and +5.1% YoY.
With the shutdowns also comes pent-up demand. Recent readings on the various purchasing managers reports would suggest growth in manufacturing is gaining momentum. The Markit US Manufacturing PMI for January came in at 59.2, up from December’s 57.1, while the ISM Manufacturing number came in at 58.7 and ISM New Orders at 61.1. Tellingly, the ISM Prices Paid Index blew past expectations, hitting 82.1 in January.
The Federal Open Market Committee met in January and reiterated its pledge to keep interest rates low for some time. As the vaccination process gains momentum following early stumbles, it’s likely economic activity will gain steam going into the summer and peak in the latter half of the year.


Domestic Equity
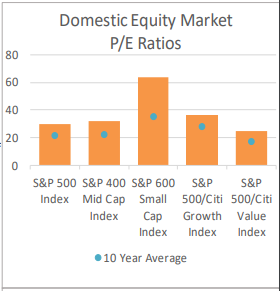
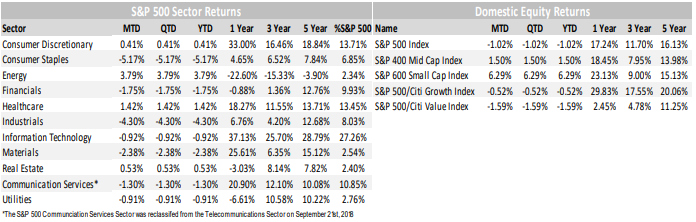
US Large-Cap equities kicked off the new year by setting new all-time highs on the S&P 500, only to fall -3.3% last week and close the month of January down -1.1% at 3,714. Small-Caps, as measured by the S&P 600 Index bucked the trend, gaining +6.29% during the month. The performance of smaller cap companies was a standout, as even Mid-Cap stocks as measured by the S&P 400 Index rose only +1.40%. Over the past three months, performance has been heavily skewed “down cap” towards Small- and Mid-Cap companies, which returned +36.06% and +23.56%, respectively, while the S&P 500 only gained +14.05%. That stellar performance has altered the return landscape of the past 12-months, with Small-, Mid-, and Large-Caps returning +23.18%, +18.46%, and +17.25%, respectively.
From a style perspective, Growth stocks, as measured by the S&P 500 Growth Index outperformed Value stocks, as measured by the S&P 500 Value Index, despite positive earnings announcements from index heavyweights
Apple and Microsoft. Both stocks saw their shares slip after earnings, perhaps used as a source of funds given their 2020 run ups. For the month, Growth returned -0.51% vs. Value, which returned -1.58%; however, for the
past three months Value remains ahead of Growth by 1.38 percentage points.
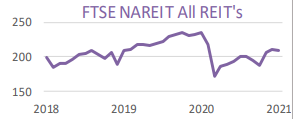
At the sector level, 7 of 11 sectors finished January in the red, with the only positive performers in the Energy (+3.79%), Healthcare (+1.42%), Real Estate (+0.53%), and Consumer Discretionary (+0.41%) spaces. Notable negative performers included Consumer Staples (-5.17%) and Industrials (-4.30%). Over the past 12-months, Utilities (-6.65%) and Real Estate (-3.03%), are two of four sectors with negative returns; however, as markets digest earnings and grapple with last month’s nearly doubling of volatility, these defensive areas could come back into favor as investors seek refuge and re-calibrate views on where interest rates are headed in 2021.

Looking ahead, our focus remain on earnings and sentiment, within the COVID-19 vaccine rollout. We’re currently in the heart of earnings season, with nearly 1/3 of S&P 500 companies having reported last week. Sentiment remains elevated (see GameStop, IPOs, SPACs, etc.) on many levels, and the expected vaccine rollout continues to hit snags here in the U.S. and globally. Stay tuned.
International Equity
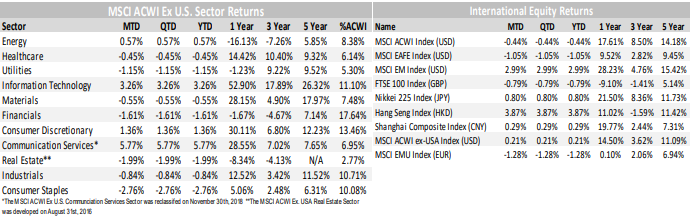
International Equities kicked off 2021 on mixed footing, with Developed Markets (DM) equities, as measured by the MSCI EAFE Index, falling -1.05% while their Emerging Markets (EM) brethren, as measured by the MSCI EM Index, gained +2.99%.
Emerging Markets picked up where they left off in 2020, posting strong gains led by Large-Cap stocks in Asia such as Tencent, which gained +20.83% on the month. China remains a top performer, with the MSCI China Index up +7.36% YTD, after gaining +26.70% in 2020. Chinese internet names have surged in recent weeks, even amidst risks of Government regulation, as Alibaba founder Jack Ma resurfaced and a flurry of new IPOs continue to drum up demand. Within China, the domestically focused “A Share” market, as measured by the MSCI China A Index, gained +3.64% on the month, after gaining +61.61% in 2020. The A Share market continues to benefit from cyclicality (i.e. a heavy reliance on Financials and Industrials), but also the rise of the Chinese consumer. The A Share market represents a pure play on the domestic market in China, which was the only major market to post GDP growth in 2020.
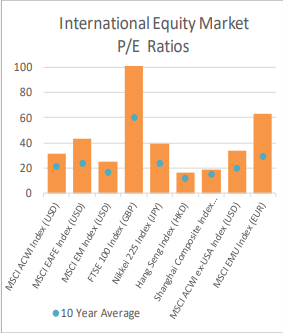
Within DM countries, notable standouts include the UK, fresh off its European Union (EU) separation, and Japan. The UK, as measured by the FTSE 100 Index, lost -0.79% in January in GBP terms, and has a trailing 12-month return of -9.10%, compared to the Eurozone, as measured by the MSCI EMU Index, which returned +0.10% in EUR terms. The disconnect between the UK and the rest of DM can also be seen in the performance of the MSCI EAFE Index over that period too, with the broad DM Index gaining +9.52% in USD terms. Reversion to the mean, increased yield, pro-cyclical exposure, and attractive relative valuations in equity and currency markets could prove opportunistic in 2021.
Japanese equities, as measured by the Nikkei 225 Index, gained +0.80% in JPY terms during the period. What’s more, Japanese equities have handily outperformed other areas of DM, having returned +21.50% over the past year, far exceeding the MSCI EAFE Index by nearly +12 percentage points. Taken together, the outperformance of Japan and Emerging Markets signals a wider performance shift towards Asia, which has arguably done a better job of containing the coronavirus than the West, and continues to post strong growth relative to the rest of the world.
As far as sectors are concerned, Communication Services (+5.77%) and Information Technology (+3.26%) were the top performing sectors within the MSCI ACWI ex USA Index on the month, while Consumer Staples (-2.76%) and Real Estate (-1.99%) were the worst performers. Looking ahead it remains to be seen whether the rotation into Value during the fourth quarter is a durable sign of a trend change. With that said, growth oriented regions like Asia and Emerging Markets, which remain pro-growth, should continue to outperform the rest of DM, which remains heavily weighted towards Value stocks on a relative basis. Should we see a pronounced shift in interest rate or inflation expectations, however, that trend could reverse in the short term. Stay tuned.

Fixed Income
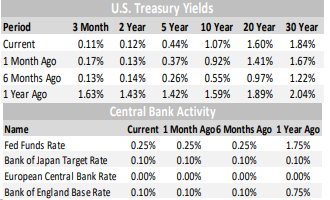
The Federal Reserve meeting came and went without causing waves. Chairperson Powell warned against tapering economic support too soon, as the market wondered about timing (after some other Fed board members gave speeches that included talk of how support could be withdrawn when necessary).
Janet Yellen has been confirmed as Treasury Secretary, and is being vocal about the need for additional economic support. Historically, she has been quite dovish, and being a labor economist by trade, she will want to see significantly lower unemployment statistics prior to withdrawal of fiscal and monetary support measures.

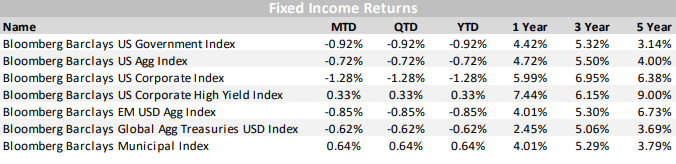
The largest impact on the bond market was the Democratic sweep in Georgia’s Senate runoff elections, which swiftly pushed yields higher for intermediate and longer duration Treasuries. Yields moved the most at the 20-year mark (+19 bps), followed by the 30-year Treasury (+17 bps), and the 10-year Treasury (+15 bps). The move higher in rates was the main driver of negative fixed income performance in the month.
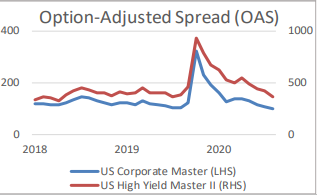
Investment Grade and High Yield spreads initially tightened, helping to offset the impact of rising rates, but ended up giving back most of these gains going into month end. High Yield was able to close out the month with positive performance. This was driven by its lower duration and higher coupon income. Credit spreads remain quite tight, as the market looks through pandemic concerns.
Municipal bonds may look expensive compared to Treasury yields and historical ratios, but they managed to turn in the best performance during a month of primarily negative fixed income returns. There is still value on the long-end with 30-year maturities offering ~80% of the Treasury bond’s yield. Current valuations and performance are likely not-unrelated to the results of the Georgia election. Tax-free income appears poised to become even more valuable, as talks of rising Federal and State tax regimes are now commonplace and likely to be enacted.
Alternative Investments
Alternative Investments had mixed performance in January, starting out a rocky new year.
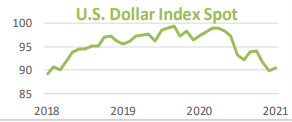
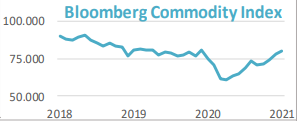
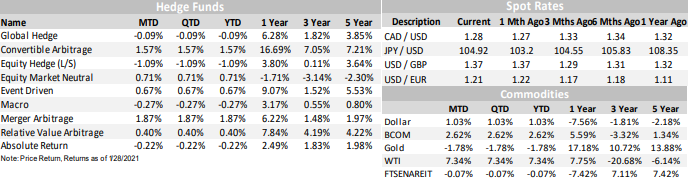
Commodities, as measured by the Bloomberg Commodities Index, rose +2.62% on the month. The direction of the US Dollar and whether or not inflation breaks out of its subdued levels over the past decade will be a key factor in how commodities perform.
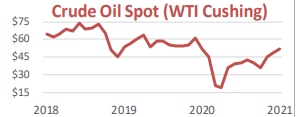
West Texas Intermediate (WTI) crude oil was up +7.34% in January to close at over $52/barrel on the NYMEX. Risk-on sentiment, falling inventories, and a tightening oil market have been factors in the price climbing higher.
Hedge Fund strategies had mixed results during the month, with 5 of the 9 nine strategies tracked posting positive returns on average. Hedge funds have been a hot topic due to the recent GameStop short squeeze against Melvin Capital amongst others, a fund that reportedly lost 53% on its investments in January. This highlights one of the many risks short-sellers face. Complicated strategies that have generally underperformed the market as well as very high internal costs have made hedge funds increasingly out of favor year after year.
Merger Arbitrage strategies were the top performer, up +1.87% on the month, while Equity Hedge (Long/Short) strategies were the worst performer, losing -1.09% during the period. Merger Arbitrage strategies, also available in mutual fund form, have performed well over multiple time periods with limited volatility, and are positioned well for the future if deal activity remains elevated.
ESG
The New Year started off with continued outperformance for many ESG strategies. Perhaps not surprising, following a year of unprecedented demand for ESG integrated investments.
Morningstar’s “Global Sustainable Fund Flows Report” noted that the final quarter of 2020 was record breaking for sustainable fund flows, assets (up 29% from prior quarter), and product launches (196 new offerings, plus hundreds of “sustainable” rebrandings). Global inflows into sustainable funds exceeded $150 Billion, an increase of 88% from the prior quarter. The flows were dominated by Europe, but the U.S. share of fund flows has been growing.
The Biden administration is expected to be very supportive of ESG integration into the investment process, and has begun to make moves that support this view. The recent Department of Labor rule that was meant to exclude or significantly limit the use of ESG investment strategies within retirement plans will be placed under review. Aron Szapiro of Morningstar goes so far as to say, “Rather than avoiding ESG analysis, we believe that 401(k) plan investment committees should have an obligation to consider ESG risk. Doing so is fundamental to evaluating the long-term performance of an investment.”
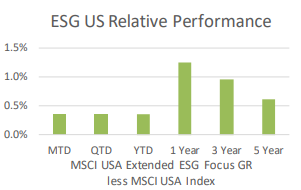
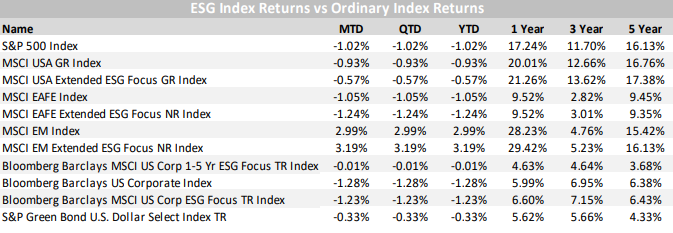
Continued strength in U.S. ESG returns was seen in January, further boosting the historical outperformance offered by taking ESG into consideration in the investment process.
ESG EAFE returns fell back slightly, as the first month of 2021 was not kind. Longer dated returns are breakeven at 12 months and accretive at 36 months, with a slight lag still registering for the 5 year period.

ESG thrives in Emerging Markets, adding to returns over all time periods, with the numbers over the past 12 months truly shining.

Originally published by Nottingham Investment Management
Nottingham Advisors, Inc. (“Nottingham”) is an SEC registered investment adviser with its principal place of business in the State of New York. Nottingham and its representatives are in compliance with the current registration requirements imposed upon registered investment advisers by those states in which Nottingham maintains clients. Nottingham may only transact business in those states in which it is registered, or qualifies for an exemption or exclusion from registration requirements. This material is limited to the dissemination of general information pertaining to Nottingham’s investment advisory/management services. Any subsequent, direct communication by Nottingham with a prospective client shall be conducted by a representative that is either registered or qualifies for an exemption or exclusion from registration in the state where the prospective client resides.
The information contained herein should not be construed as personalized investment advice. Past performance is no guarantee of future results. Information contained herein should not be considered as a solicitation to buy or sell any security. Investing in the stock market involves the risk of loss, including loss of principal invested, and may not be suitable for all investors. This material contains certain forward-looking statements which indicate future possibilities. Actual results may differ materially from the expectations portrayed in such forward-looking statements. As such, there is no guarantee that any views and opinions expressed in this letter will come to pass. Additionally, this material contains information derived from third party sources. Although we believe these sources to be reliable, we make no representations as to the accuracy of any information prepared by any unaffiliated third party incorporated herein, and take no responsibility therefore. All expressions of opinion reflect the judgment of the authors as of the date of publication and are subject to change without prior notice. Past performance is not an indication of future results.
The indices referenced in the Nottingham Monthly Market Wrap are unmanaged and cannot be invested in directly. The returns of these indices do not reflect any investment management fees or transaction expenses. Had these additional fees and expenses been reflected, the returns of these indices would have been lower. Information herein has been obtained from third party sources that are believed to be reliable; however, the accuracy of the data is not guaranteed by Nottingham Advisors. The content of this report is as current as of the date indicated and is subject to change without notice.
For information pertaining to the registration status of Nottingham, please contact Nottingham or refer to the Investment Adviser Public Disclosure web site (www.adviserinfo.sec.gov). For additional information about Nottingham, including fees and services, send for our disclosure statement as set forth on Form ADV from Nottingham using the contact information herein. Please read the disclosure statement carefully before you invest or send money.
