
Economic Overview
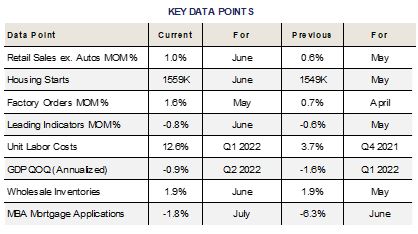
 Second quarter GDP declined by an unanticipated -0.9%, following Q1’s -1.6% pullback, fitting the historical definition of a Recession of two consecutive quarters of negative GDP. The National Bureau of Economic Research, the arbiter of what actually qualifies as a recession, has more recently broadened its actual definition to include the qualitative component of “a significant decline in economic activity that is spread across the economy and that lasts more than a few months”. Given the world’s recent emergence from a pandemic (or in China’s case, an ongoing battle with Covid), we’re willing to cut the NBER some slack and go with the more qualitative version of the definition.
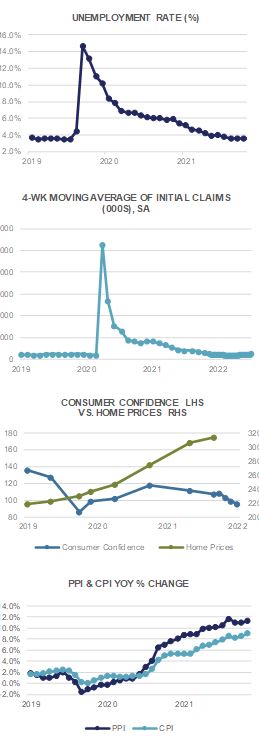
Regardless, economic data is pointing to a slowdown in the U.S. economy, which is not too surprising given the Federal Reserve’s +250 basis points of tightening thus far in 2022. July’s 75 bp hike in the Fed Funds rate likely brings the Fed “current” in its battle with inflation, although history suggests Fed Funds needs to be raised above the rate of inflation before victory can be declared. June’s +1.3% MoM rise in CPI (+9.1% YoY) along with PPI’s +1.1% MoM increase (+11.3% YoY) suggests inflation continues to run hot, although perhaps peak price pressures have been set. Ex Food & Energy, consumer prices have risen +5.9% from a year ago while Producer Prices are up +8.2%. The Fed’s favored measure of inflation, the PCE Core Deflator has risen +4.8% over the past 12 months.
In order to gauge the effectiveness of Fed rate hikes in the battle against inflation, economists are watching Initial Jobless Claims closely to see whether corporate America is cutting back on hiring in the face of higher interest rates and slowing growth. Any rise in claims would likely be viewed favorably in that destroying the demand for labor is a necessary element in bringing inflation down. Weekly Initial Jobless Claims numbers began July at 235k per week and closed the month up at 256k, so perhaps the medicine is working. The Unemployment Rate in June came in at +3.6%, near historic lows, while the JOLTS Job Openings number for May remained robust, north of +11 million.
Corporate earnings for the second quarter have thus far been a mixed bag (more on that in the Equity section); however, the major tech companies reporting so far have indicated that things may not be quite as bad as feared. The Fed will likely need to continue raising rates into the 4th quarter, although probably at the more measured pace of 25 bps per meeting. Signs of a slowing US economy will give the Fed cover for a more deliberate and perhaps slower pace of tightening, perhaps spurring risk assets higher. In essence, bad news in the short term could prove to be good news in the long run.
Domestic Equity
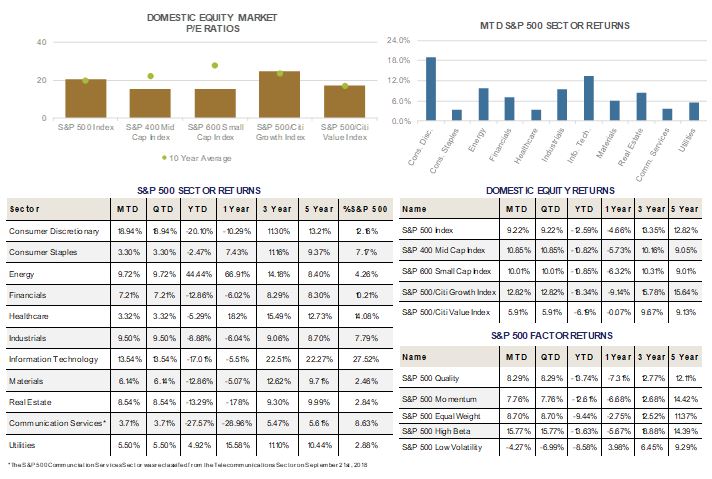
U.S equities breathed signs of life in July on the back of better than expected earnings news and a potential Fed pivot. The benchmark S&P 500 Index closed out the month on a high note, gaining +9.22% to close at 4,130. July’s gains represented the highest monthly return since November 2020. Mid- and Small-Caps rallied sharply as well, with the S&P 400 and 600 Indices gaining +10.85% and +10.01%, respectively. With July’s gains, the S&P 500, 400, and 600 Indices are now down -12.59%, -10.82%, and -10.85%, respectively, having clawed back nearly half their respective losses since June 16’s bottom. Whether or not the actual bottom is in or not remains to be seen of course, and will only be known with the benefit of hindsight; however, with the earnings apocalypse that wasn’t, and a Federal Reserve that appears to have pivoted in its monetary policy outlook equities appear to have a green light in the near-term.
From a style perspective, the S&P 500 Growth Index rebounded sharply in July, gaining +12.82%, while the S&P 500 Value Index rose only +5.91%. Despite July’s outperformance, Growth has still underperformed Value by more than 12 percentage points year to date.
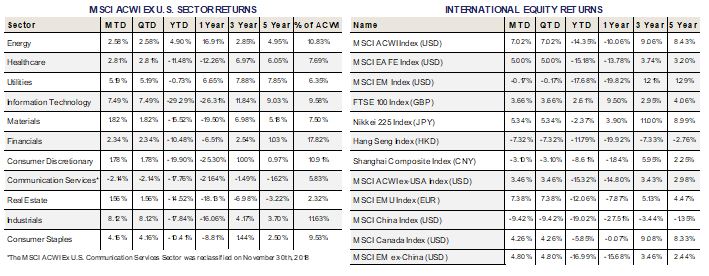
From a sector perspective, Consumer Discretionary surged +18.94% last month on the back of a positive earnings release from Amazon, which represents nearly a quarter of the sector market cap. Similarly positive announcements from Apple and Microsoft helped propel Information Technology by +13.54% (the companies make up nearly half the sector market cap). Apple’s results beat expectations, with the impact from China more muted than last quarter’s guidance (re: $4-8 Billion impact during the quarter was actually less than $4 Billion), while Microsoft posted strong cloud results from Azure and offered a positive outlook (after recently pre-announcing weaker expectations). Energy and Industrials were the next best performers, gaining +9.72% and +9.50%. Record profits from the likes of Exxon and Chevron, coupled with resilient economic activity boosted the sectors during the period.
After a outperforming the market on a relative basis for much of the year, defensive sectors such as Consumer Staples, Healthcare, and Utilities were laggards on the month, gaining +3.30%, +3.32%, and +5.50%, respectively. Another laggard was Communications Services, which rose +3.71% on the month. While not defensive in nature, the sector lagged on an earnings miss from Meta, and a better than feared report from Google.
Looking ahead, earnings estimates have started to get revised lower at the margin. At last check S&P 500 2023 earnings estimates have been revised from $252 to $246, a less than -3% cut. More revisions may come, but with inflationary pressures beginning to ease and the Fed’s recognition that the Fed Funds rate may be near “neutral”, we’ll have to wait and see just how much damage has been done to the underlying economy. Stay tuned.
International Equity
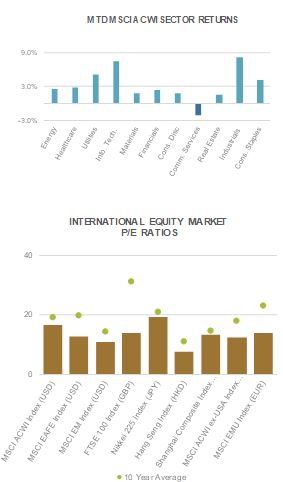 International equities were a mixed bag in July. Developed Markets (DM), as measured by the MSCI EAFE Index rose +5.00%, dented slightly by a stronger US Dollar. Emerging Markets (EM), as measured by the MSCI EM Index, were basically flat on the month, down -0.17%. After China’s sharp rebound in June, the MSCI China Index gave back most of its outperformance, and ended the month down -9.42%. China’s drag on the broad index is perhaps most pronounced by the MSCI EM ex-China Index, which gained +4.80% during the month.
China’s impact on Emerging Markets cannot go understated at nearly one third of the EM market cap; however, diverging results from many other EM countries risks painting all of EM with a broad brush. To be sure, EM is not immune from the risks facing global equities; however, many have hiked rates to combat inflation already and may be in a stronger position than past downturns (i.e. able to cut rates).
Strength in the US Dollar was pronounced in the performance of the Eurozone, with the MSCI EMU Index returning +7.38% in EUR terms, but only +4.45% in USD terms. The Euro fell below parity with the Dollar for the first time in more than 20 years as economic weakness and inflationary pressures cloud the bloc’s outlook. The European Central Bank (ECB) hiked rates by 0.50% in July, but risks pushing the economy into a deeper recession. In the near term, Germany’s economic slowdown is of paramount concern, as are widening borrowing costs on the periphery (i.e. Italy). How the ECB manages diverging needs from its economic powerhouses remains to be seen.
In Japan, the Nikkei 225 Index rose +5.34% in JPY terms and +7.21% in USD terms as the Yen strengthened against the Dollar. The Bank of Japan (BoJ) remained steadfast in its monetary policy framework of low rates. The Fed’s pivot could put upward pressure on the Yen, causing it to rally versus the Dollar if the pace of Fed rate hikes has indeed slowed.
Looking north of the border to Canada, the MSCI Canada Index gained +4.26% on the month in USD terms after a 100bp rate hike by the Bank of Canada during the month. The Loonie has remained incredibly stable versus the Dollar when compared to other global currencies, helped by a close dependence on the USA and heavy exposure to energy and commodities. The MSCI Canada Index is down -5.85% year to date, compared to -14.35% for the MSCI All Country World Index (ACWI), and essentially flat over the trailing 1-year period, down only -0.07%.
At the sector level, Industrials and Information Technology were the top MSCI ACWI ex-US sectors on the month, up +8.12% and +7.49%, respectively. Communication Services was the lone negative performer, down -2.14% during the period.
Fixed Income
In the month of July, the yield curve performed a twist, with short-term yields rising as longer maturity yields declined. The curve pivoted on the three year maturity point, with that maturity’s yield roughly flat for the month.
With inflation continuing to print much higher than the Federal Reserve’s two percent target, a large increase in the Federal Funds interest rate was expected at the most recent meeting, ended on July 27th. Chairperson Jerome Powell did not disappoint, announcing a 75 basis point increase to the target range, which is now 2.25% to 2.50%. This increase was expected by the market. In the press conference following the announcement, Powell’s tone was judged to be less aggressive than expected, seeming to imply that the Federal Funds rate was now at/near the neutral rate. This fueled a rally in risk assets. The next day, second quarter GDP was released, showing a second consecutive quarter of negative economic growth.
The Government bond index posted positive performance in July, but returned less than all the competing indices tracked. This is driven by the risk rally witnessed in July, creating a performance tailwind for the higher risk (not government backed) bond exposures. Year to date, Government bond exposure remains among the best performers because it is immune to the negative impact of spread widening which has hurt corporate bond performance.
Investment Grade corporate bonds saw their credit spreads tighten marginally in the month. This combined with falling yields on longer maturities gave Investment Grade bond prices a significant boost, resulting in the second best monthly performance.
High Yield credit spreads contracted noticeably in July, as risk assets rallied. This provided a strong boost to prices in the month, and combined with the additional income provided by High Yield exposure, resulted in this index leading the way in July performance by a wide margin. Year to date, High Yield performance does continue to lag Government and broad fixed income market exposure, but the gap has decreased given the recent performance surge.
Municipal bonds also had a strong month of performance, as their prices rose more than similar maturity Treasury bonds.

Alternative Investments
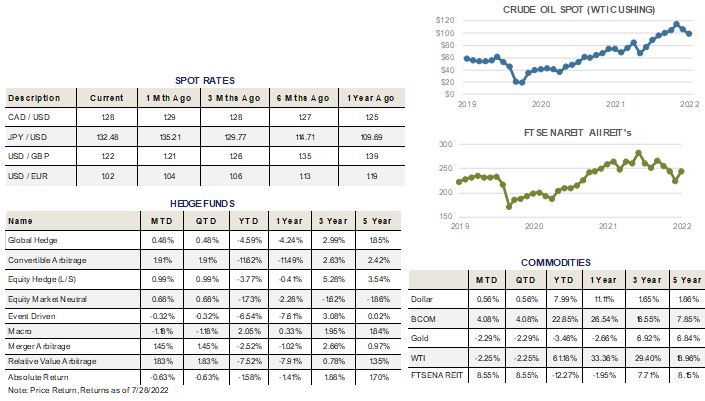
 Alternative investments had mixed results in July. High inflation and monetary tightening hit consumer demand for some commodities but general risk assets rebounded during the month. Broad commodities, as measured by the Bloomberg Commodity Index, were up +4.08% for the month.
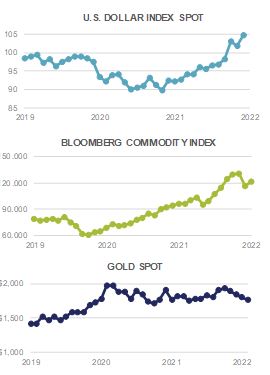
Several areas of the commodity market have sold off significantly from their highs and a strong US Dollar has been one cause. Commodities are usually negatively correlated to the US Dollar as a higher dollar often means raw inputs are more expensive for buyers around the world. The US Dollar and Euro hit parity intra-month for the first time in 20 years amid US Central bank tightening before the US Dollar slightly weakened near the end of the month. Any significant weakening in the US Dollar in the future could act as a further boon for commodities.
WTI crude oil returned -2.25% for the month, as the price of oil closed July at $98.62 per barrel. This was a rare negative monthly return in 2022 as oil remains up +61.8% YTD. The slight decline also translated to AAA’s measure of the average US gas price, which ended the month at $4.212 per gallon, a more than 50 cent decline from a month ago.
Real estate also rallied in-line with global equities, as the FTSE NAREIT Index returned +8.55% in July. Slightly lower interest rates and a return of risk-on mentality supported the rally.
Hedge fund strategies had mainly positive results during the month, with six out of nine strategies tracked posting positive returns on average. Convertible Arbitrage strategies were the top performer during the month, while Macro strategies were the worst performing strategy over the period.
ESG
 With inflation and energy prices continuing to dominate the news, it is not particularly surprising to see strategies that try to manage/minimize their carbon footprint trailing their unconstrained benchmarks. An interesting outlier, the ESG integrated EAFE exposure (arguably, the hardest hit by rising energy prices) was able to post outperformance in the month of July.
The current energy struggles have created more interest in energy independence, and reducing/eliminating a dependence on fossil fuels, particularly those supplied by unfriendly nations. This should create a longer-term tailwind for green energy development and increasing the sustainability of company practices, reducing fossil fuel usage.
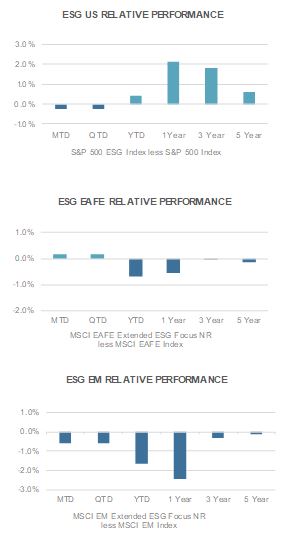
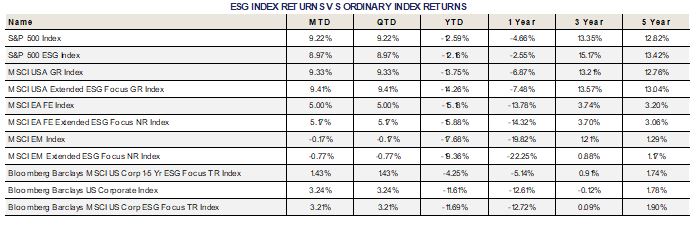
In July, the ESG integrated EAFE return beat its benchmark. The ESG integrated S&P 500 and the Emerging Markets exposures underperformed their non-ESG integrated counterparts in the month. The ESG integrated corporate bond index also underperformed its non-ESG integrated benchmark in July.
The ESG aligned U.S. index underperformed its non-ESG counterpart by 25 basis points in the month of July. Year-to-date the ESG exposure outperformed by 43 basis points. The one year, three year, and five year time periods also remain additive to performance compared to the non-ESG aligned benchmark, strongly supporting ESG integration in portfolios.
ESG integrated EAFE returns experienced 17 basis points of outperformance in July. Year-to-date, the performance of ESG integrated EAFE trailed its benchmark by 70 basis points. Longer time periods also demonstrate some level of underperformance, with the three year and five year numbers being close to breakeven.
Emerging Markets ESG equity performance trailed its benchmark in July, underperforming by 60 basis points. This year has been particularly volatile in the Emerging Market category, reversing its strong track record of being accretive to performance. The year-to-date number shows 168 basis points of underperformance. All longer time horizons also currently trail the non-ESG integrated benchmarks. Similar to the EAFE results noted above, three year and five year time horizons begin to approach breakeven with the non-ESG integrated exposures.
ESG integrated Investment Grade corporate bonds underperformed their non-ESG equivalent by 3 basis points in July. Year-to-date ESG integrated Investment Grade bonds also slightly trail their non-ESG benchmark, lagging by 8 basis points. The one year return trails by 11 basis points, while the three and five year numbers continue to show outperformance.
For more news, information, and strategy, visit VettaFi.com.
