
Economic Overview
 Although an inverted yield curve and consecutive quarterly declines in GDP might fit the “old” definition of a recession, the economic data published in August didn’t quite corroborate that view. Continued low unemployment, robust job openings and PMI readings around 50 would seem to suggest that while the rate of growth might be slowing, the US economy continues to expand as we recover from 2 years of Covid-related disruptions. Taking into account the latest hawkish rhetoric emanating from Fed Chair Powell at the widely anticipated Jackson Hole confab, we should be expecting progressively higher short-term interest rates as the Fed doubles down on its commitment to return inflation to the 2% level. This would suggest that economic growth measures going forward should be lower/slower, while unemployment should tick-up and job openings fall, possibly dramatically.
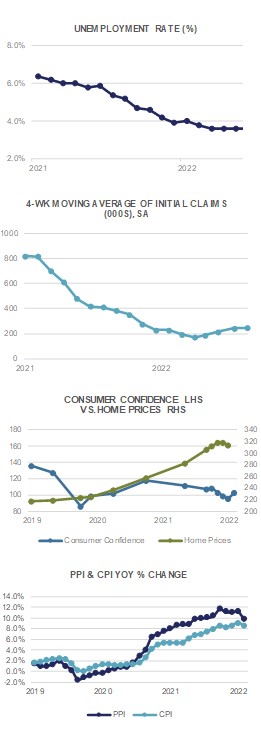
As things stand today, the U.S. Unemployment Rate for July was 3.5%, while the Underemployment Rate stood at just 6.7%. Average Hourly Earnings jumped +0.5% MoM, and now stand at a heady +5.2% above the level one year ago. The Labor Force Participation Rate, which once hovered around 66% back in the 2000’s, registered 62.1% in July, above the pandemic low of 60.2%, but still below the pre-pandemic level of 63.4%. The labor market in the U.S. remains one of the biggest conundrums facing economists, with the Baby-Boom generation retiring and the more robust Millennial generation comprising the bulk of the work force. The data remains noisy as employment trends change, however the latest JOLTS Job Openings survey showed more than 11 million positions available.
As suggested above, PMI surveys show a US economy right at the edge of stall-speed, however still expanding. The S&P Global US Manufacturing PMI preliminary reading for August came in at 51.3, while the Services PMI reading was just 44.1. The MNI Chicago PMI reading for August beat expectations at 52.2. Industrial Production in July ticked up +0.6% MoM while Capacity Utilization increased slightly to 80.3%. Durable Goods Orders for July were unchanged following June’s +2.0% increase.
The Kansas City Fed’s annual August symposium, held in iconic Teton National Park, was perhaps the most anticipated event of August. Although clocking in at just 10 minutes in length, Chair Powell’s speech messaged in no uncertain terms that the Fed would continue to raise interest rates until inflation was brought under control – a message markets weren’t quite anticipating. Going forward, “bad news” could be viewed as “good news” should it lead to an earlier cessation of rate hikes. The plot thickens.
Domestic Equity
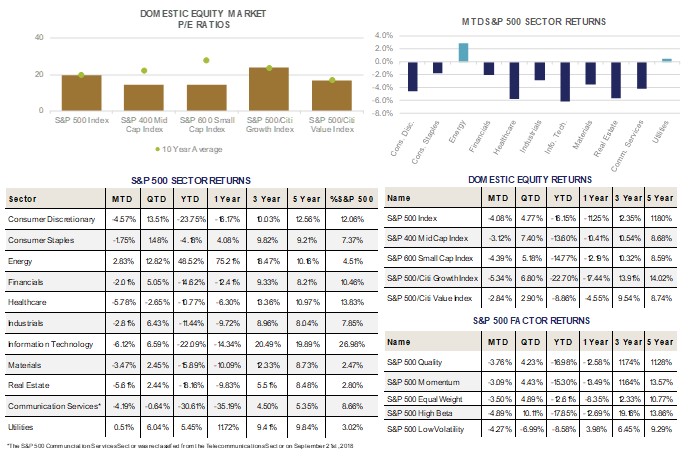
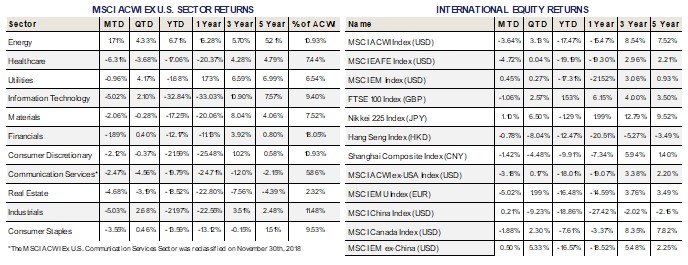
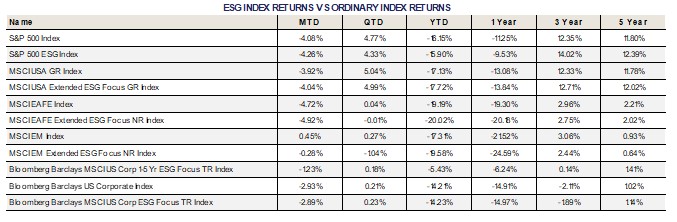
U.S. equities reversed course in August, with the benchmark S&P 500 Index falling -4.08%. After a strong rebound in July, the Large-Cap Index now stands up +4.77% on the quarter, and down -16.15% for the year. Mid- and Small-Caps fared similarly, with the S&P 400 and 600 Indices falling -3.12% and -4.39%, respectively. For the quarter, both Mid- and Small-Caps have outperformed their Large-Cap peers, gaining +7.40% and +5.18%, respectively, and have also outperformed on a year to date basis. We continue to believe that U.S. Small-Cap valuations look attractive, in both absolute and relative terms. The S&P 600 Index currently trades at 11.8x 2023 earnings, despite a recent pullback in estimates.
From a style perspective, Growth underperformed Value by -250bps on the month as interest rates and volatility rose. Value stocks continue to be buffeted by lower valuations and higher dividend yields, which have helped cushion some of the downside year to date. For the year, the S&P 500 Growth Index has lost -22.70%, compared to -8.86% for the S&P 500 Value Index.
At the sector level, energy and defensive sectors continue to rule the day given the uncertainty at home and abroad. Energy stocks gained +2.83% in August, despite a drop in oil prices, and are up +12.82% and +48.52%, respectively for the quarter and year. Setting Energy aside, defensive sectors such as Utilities (+0.51%) and Consumer Staples (-1.75%) continued their outperformance on the month. For the year, Utilities remain the only sector (besides Energy) in the black, up +5.45%. Consumer Staples are the next best performer down -4.18%, despite inflationary headwinds eating into margins. Valuations for both Utilities and Consumer Staples look unattractive, trading at significant premiums to the overall market. Technology was the worst performer on the month, losing -6.12%, which was nearly half (-1.71%) of the S&P 500’s -4.08% decline. Close behind was Healthcare, which lost -5.78% on the month. Interestingly, Healthcare has not provided much defensiveness in recent months, underperforming the market for the quarter by nearly 750bps, despite outperforming year to date by more than +500bps.
Looking ahead, earnings estimates remain a key input into our overall macroeconomic view. S&P 500 estimates for 2022 have come in slightly, from $252 at their peak, to $244 at the end of August, down -3.16%. At present levels, the S&P 500 trades at 16.2x next year’s earnings estimates, in-line with its 10-year average.
International Equity
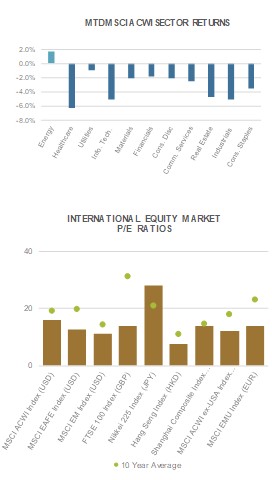 International equities were a mixed bag in August, with a stark divergence between Developed Markets (DM) and Emerging Markets (EM) performance. DM, as measured by the MSCI EAFE Index shed -4.72% on the month. This compares to EM, as measured by the MSCI EM Index, which gained +0.45% during the period.
Developed Market returns, specifically in Europe, were hurt by a strong Dollar, surging energy prices, and a worsening macro environment of slowing growth and rising inflation. In the United Kingdom, the FTSE 100 Index lost -1.06% in GBP terms, but add in the Pound’s weakness, and the FTSE 100 lost -6.18% in USD terms. Similarly in the Eurozone, the MSCI EMU Index lost -5.02% in EUR terms, and -7.01% in USD terms thanks Euro weakness versus the Dollar. The Euro finished the month at parity with the Dollar after flirting with weaker levels throughout the course of the month. Growth has slowed materially in all of Europe as the fallout from surging energy prices ripples through the region. Inflationary pressures have accelerated, with the likelihood of high double digit inflation not a trivial probability. Nearly all types of power (i.e. Natural Gas, Oil, Electricity) have seen their prices rise dramatically in recent months, causing some businesses to shut down. Even as Oil prices have receded due to a weakening global growth outlook, Natural Gas prices have remained high as Russia has limited flows. Power prices recently crossed the 1,000 Euro/mwh threshold, which is clearly unsustainable. All this comes as the European Union’s blacklist of Russian oil hasn’t even started yet, but will in December. It is likely to get worse before it gets better in Europe. Stay tuned.
Turning to Emerging Markets, the MSCI EM Index gained +0.45% during the month, helped by a rebound in Chinese equities. The MSCI China Index gained +0.21% on the month, which while scant, makes up nearly one third of the EM Index. Returns were helped by reserve ratio cuts from the Peoples Bank of China (PBOC) and news of an agreement between the U.S. and China for the Public Company Accounting Oversight Board (PCAOB) to review audit work papers of certain U.S. listed companies such as Alibaba and JD.com. At current junction, the MSCI China Index trades at 10.4x 2023 earnings, compared to a 5-year average of 11.8x and 10-year average of 10.6x.
From a single country perspective, Japan contributed to negative DM returns as the Nikkei 225 Index gained +1.10% in JPY terms, but lost -2.84% in USD terms as the Yen plumbed new decade lows versus the Dollar. In Canada, the MSCI Canada Index lost -1.88% in August, and is down -7.61% for the year, outperforming MSCI ACWI ex USA by more than 1,000bps.
Fixed Income
Following the July Federal Reserve meeting and press conference where Chairperson Powell raised expectations for less aggressive monetary tightening (a Fed pivot), risk assets celebrated by rallying significantly. After his more sternly worded speech at Jackson Hole on August 26th, some of the gains experienced have been given back. Powell was more resolute, more focused on the responsibility to bring inflation down. He acknowledged that without price stability, the economy does not work for anyone, and certainly not for all. Perhaps most importantly, he noted that “The burdens of high inflation fall heaviest on those who are least able to bear them.” The Fed has committed to remaining vigilant in their fight against inflation, and the market has begun to price that in. While the speech was short and meant to make a point, it was notable that there was no mention of a soft landing for the economy.
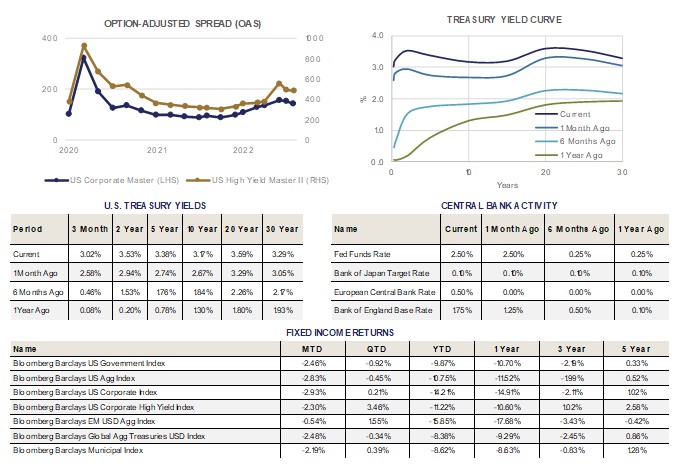
Yields moved higher across all maturities in August. This move put downward pressure on bond prices, causing a generalized contraction in returns. The additional interest income offered by High Yield securities allowed for a strong monthly return on a relative basis.
The Treasury yield curve remains inverted, with the 2-year maturity yielding more than the 10-year maturity. This traditionally signals slowing economic growth, and often recession. Typically, the 3-month Treasury will also yield more than the 10-year Treasury prior to a recession. So far, this has not happened, but we are at the closest to a 3-month/10-year inversion since early 2020 as the economy rolled into the pandemic recession.
Investment grade spreads tightened through mid-August, then reversed course and gave back some of the move. High Yield spreads also tightened through mid-August before the rally stalled out and began moving the opposite direction. Both Investment Grade and High Yield credit spreads ended August near their highs for the year. While there has been significant widening year-to-date, current levels do not appear to reflect a high probability of recession.
In the month of August, Municipal bond performance diverged by maturity, with shorter maturities underperforming equivalent maturity Treasury bonds, while longer maturity Muni bonds outperformed.
Alternative Investments
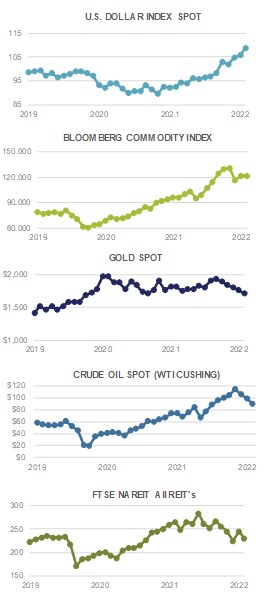 Alternative investments had mixed results during the month of August. Broad commodities, as measured by the Bloomberg Commodity Index, were relatively flat for the month returning -0.15%. Commodities provided some diversification benefits as an asset class for the period as global equities sold off broadly and rising interest rates hurt fixed income returns.
WTI crude oil fell sharply, finishing the month down -9.20% to close at $89.55 per barrel. This was the 3rd straight monthly decrease for WTI crude oil as recession fears continue to grow and global central banks are predicted to hike interest rates significantly next month. Additionally, renewed restrictions to curb COVID-19 in China has reduced demand while oil supply has returned to a more normal level. Gas prices continued to fall as well, with the AAA national average price of gas closing the month at $3.84 per gallon. The decline of prices at the pump is a welcomed sign for the consumer, although prices still remain elevated compared to a year ago.
Europe is in the midst of a full blown energy crisis that has worsened during the summer and the region still remains heavily reliant on Russian energy. Gazprom (a Russian energy corporation that is the largest publicly listed natural gas company in the world) slashed pipeline capacity in June causing natural gas prices to double in mainland Europe since then. The magnitude of energy price increases will most likely hurt the demand and supply of products, clouding the region’s economic outlook. Hot, still, and dry weather recently has also limited the ability to use wind, nuclear, and hydropower as meaningful energy substitutes.
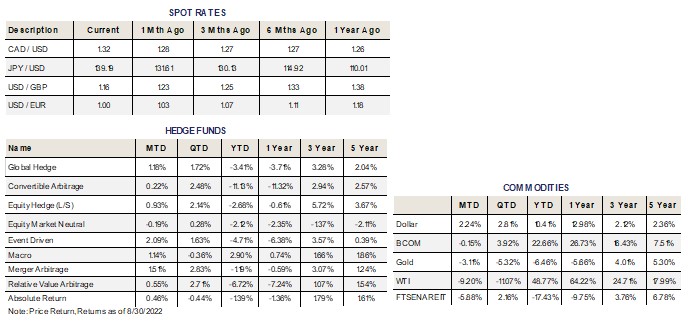
Hedge fund strategies had mainly positive results during the month, with eight out of nine strategies tracked posting positive returns on average. Hedge fund strategies have held up relatively well in 2022 but their long-term track records still lag some more liquid and accessible asset classes such as equities.
ESG
 The 2022 theme of higher prices and energy outperformance remains intact. This continues to present a headwind for ESG strategies, reflected in their August returns. In Europe, energy prices have risen to such extremes that the European Commission has said that they are exploring ways to intervene in the markets in an attempt to decouple the price of natural gas and the cost of electricity. There is also talk of limiting the price of C02 emissions (presumably, at a price lower than recent levels). This shows that even Europe is willing to walk back its climate related goals in the midst of an energy crunch.
As countries that are negatively impacted by the current energy market moves look to invest in the future, and in their independence from fossil fuels and the despotic governments that control significant portions of that market, the tailwind for ESG aligned companies will grow. Companies that have already insulated themselves from more intensive energy usage have an advantage as costs rise. Companies that produce clean energy installations were already in demand, and should be even more so for the foreseeable future.
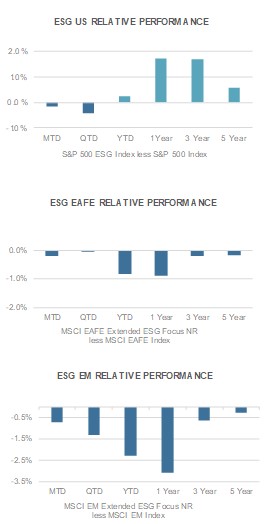
In August, the ESG integrated EAFE index underperformed its non-ESG counterpart. The ESG integrated S&P 500 and the Emerging Markets exposures unperformed their non-ESG integrated counterparts in the month as well. The ESG integrated corporate bond index slightly outperformed its non-ESG integrated benchmark in August.
The ESG aligned U.S. index underperformed its non-ESG counterpart by 18 basis points in the month of Aug. Year-to-date the ESG exposure outperformed by 25 basis points. The one year, three year, and five year time periods also remain additive to performance compared to the non-ESG aligned benchmark, strongly supporting ESG integration in portfolios.
ESG integrated EAFE returns experienced 20 basis points of underperformance in August. Year-to-date, the performance of ESG integrated EAFE trailed its benchmark by 83 basis points. Longer time periods also demonstrate some level of underperformance, with the three year and five year numbers being close to breakeven.
Emerging Markets ESG equity performance trailed its benchmark in August, underperforming by 73 basis points. This year has been particularly volatile in the Emerging Market category, reversing its strong track record of being accretive to performance. The year-to-date number shows 227 basis points of underperformance. All longer time horizons also currently trail the non-ESG integrated benchmarks. Similar to the EAFE results noted above, three year and five year time horizons begin to approach breakeven with the non-ESG integrated exposures.
ESG integrated Investment Grade corporate bonds outperformed their non-ESG equivalent by 4 basis points in August. Year-to-date ESG integrated Investment Grade bonds also slightly outperformed their non-ESG benchmark, lagging by 2 basis points. The one year return trails by 6 basis points, while the three and five year numbers continue to show outperformance.
For more news, information, and strategy, visit VettaFi.com.
