
By Roman Chuyan, CFA
- In this post, I talk about downside in a “normal” market and in a bubble, and potential triggers for the next downturn.
- Our Equity model continues with its negative 6-month outlook, dictating defensive positioning.
Stocks continued to rise year to date through August, taking the market to an even more extreme valuation. As I detailed in my recent commentaries, stock market valuation is at its highest in 150 years, barring the 1999-2000 dot-com bubble.
The economy has largely recovered after the COVID pandemic (and recently faltered), but market valuation has rocketed well above pre-pandemic highs. Clearly, fundamentals didn’t drive the upside – the Fed did. The Fed’s money-creation inflated bubbles in all assets: stocks, bonds, and real estate.
In today’s comments, I will first discuss downside in a “normal” market. A normal market goes up and down, based largely on fundamentals. Second, I talk about bubbles. Bubbles are invariably inflated by easy money. This time, it’s been created largely by the Fed. But, all bubbles burst – which means that the downside is larger than in a normal market. Third, I give a few thoughts on what might trigger the next downturn.
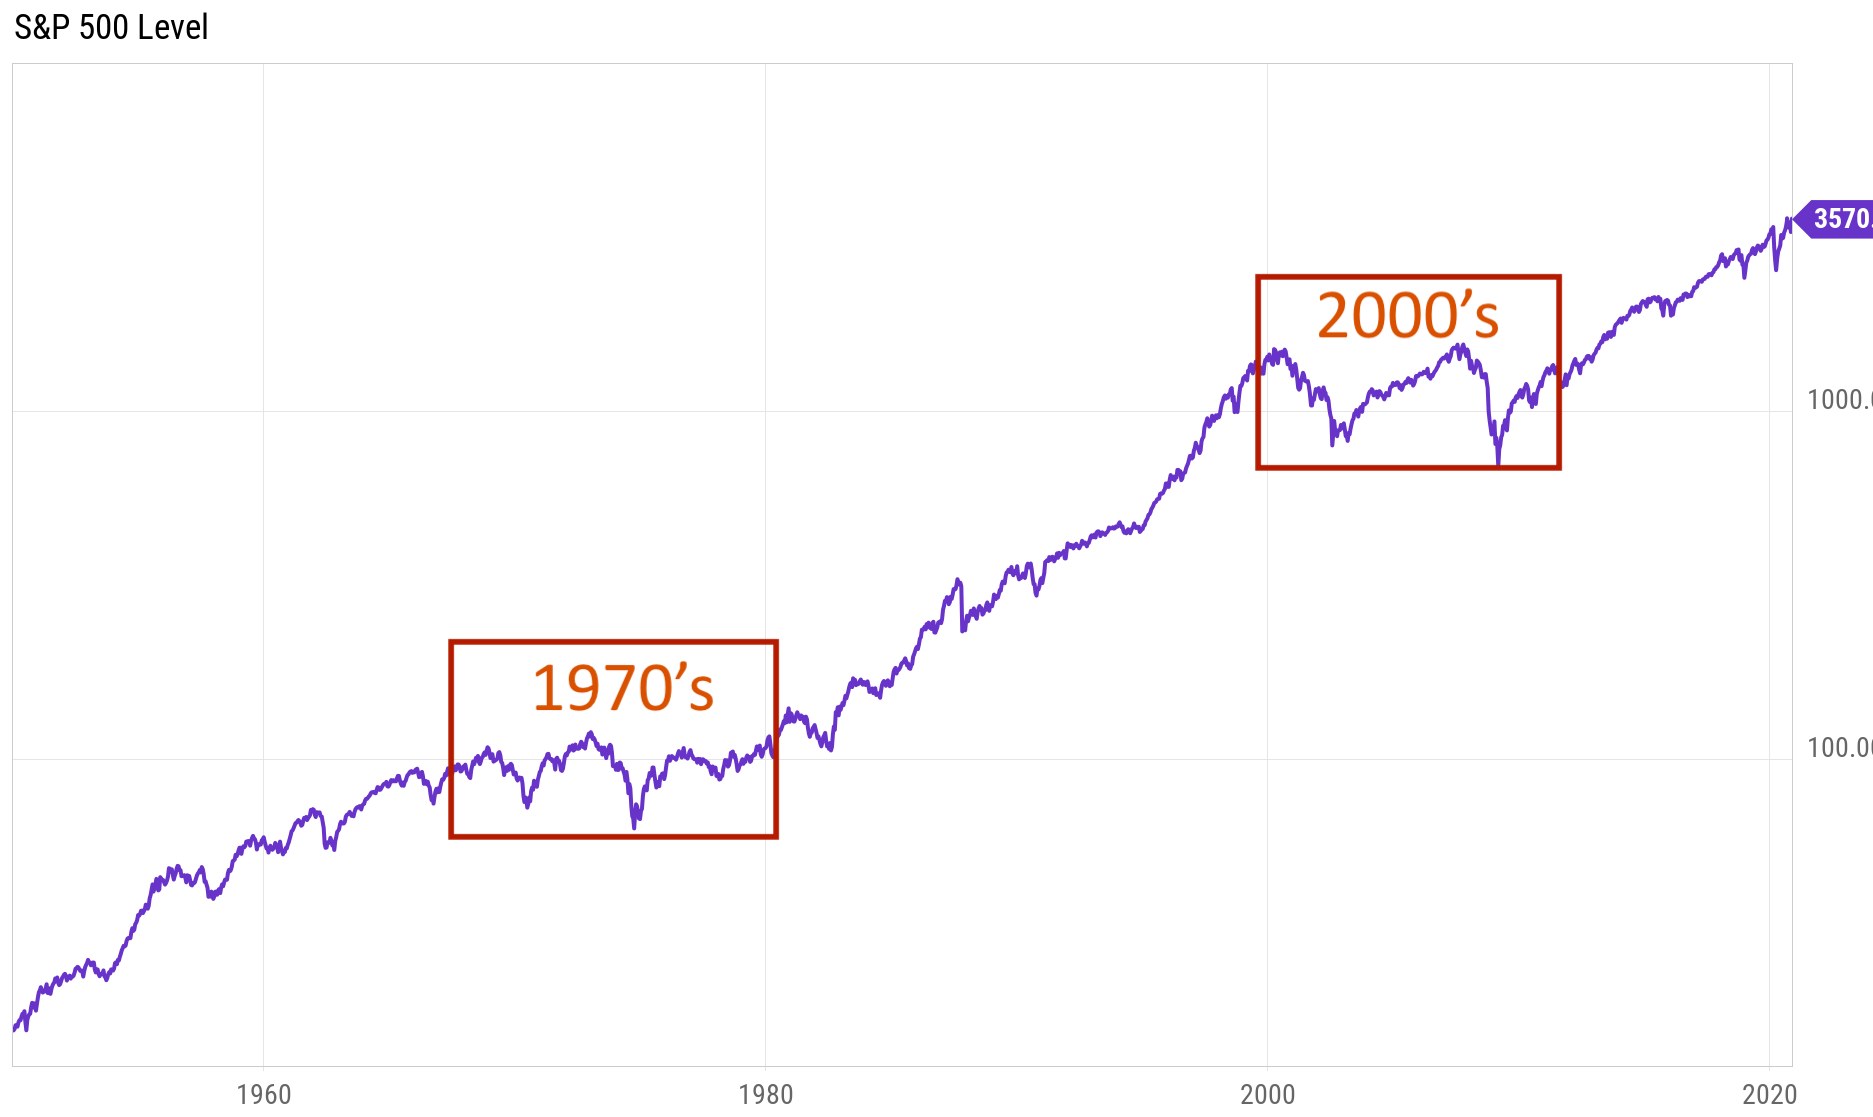
So first, a “normal” stock market goes down, as well as up. It’s obvious, but investors seem to forget the “down” part after a few years of upside – the so-called recency bias. This bias is stronger the longer the upside. The current bull market has lasted 12 years, so many investors believe they can never lose. The chart below includes a longer history for the market that’s required to see a few bull and bear markets, from 1950. This is still a “normal” market, leaving out examples of severe declines in the US and foreign markets. Even bull markets are interrupted by downturns (as in 1989, 2011, and 2020). Of bigger concern to investors were the series of bear markets in the 1970s (around -30% from peak) and the 2000s (-50%). Such bear markets can destroy wealth, especially after accounting for potential effects of trading (often driven by emotion) and of inflation. During the 1970s, even though the S&P 500 was roughly unchanged from the beginning to the end of the decade, investors lost half of their real wealth after inflation.
The S&P 500, 1950-2020
Sometimes market upside turns into a bubble, inflated by easy money. An example is the tech (dot-com) bubble of the late-1990s, financed by stock investors. An older example is the bubble of the late 1920s that ended in the 1929 crash and the Great Depression. Although it’s not as clear on these charts, most investors remember 2007 as a bubble financed by mortgages, including subprime, and also by stocks. All these bubbles were followed by a crash of at least 50%, often much larger (over 85% in 1929-33 and the NASDAQ in 2000-02).
Shiller’s P/E Ratio, 1870-2021
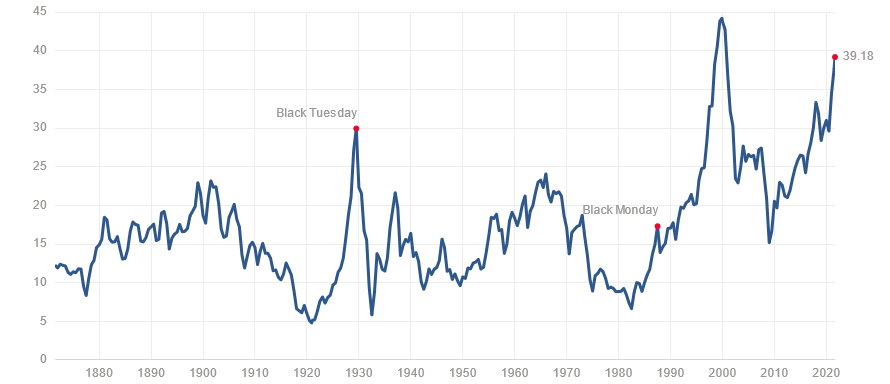
Today, only part of the current market strength is justified be the post-pandemic economic recovery. Most of it is “multiple expansion” – stocks soaring fueled by the Fed’s money-creation. Shiller’s P/E Ratio, which adjusts for earnings highs and lows, is at the highest level in its 150-year history barring 1999-2000. These 150 years include very low interest rates in late-1800s and early 1900s, when P/E reached around 20. However, the current episode of near-zero rates has created a twice-as-large bubble, with P/E now at 39.
As with all bubbles, easy money inflated the current bubble, including a zero interest rate (the light-blue line of the chart below). In addition, the Fed’s bond purchases that amount to money-creation (the orange line) and federal stimulus money have each amounted to around $4 trillion.
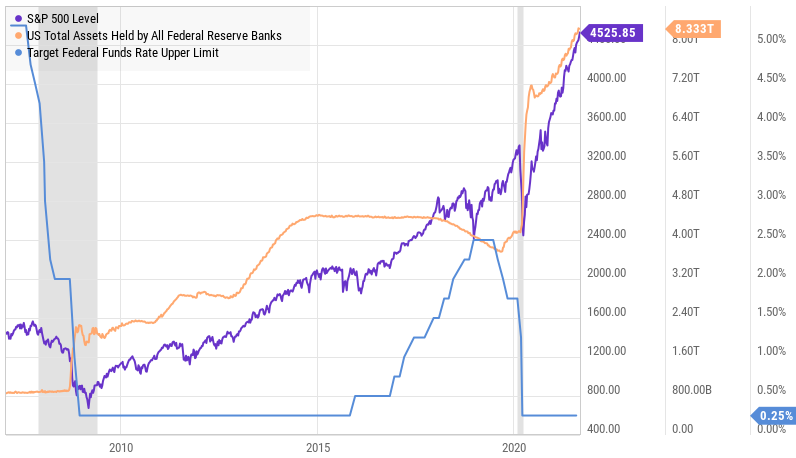
Source: Ycharts.com
So, in a normal market, stocks go down as well as up, based largely on fundamentals. Our 6-month Equity Model has been forecasting a fundamentals-based downside. Instead, the bubble got bigger. It’s unsustainable. All bubbles inevitably burst – it’s a certainty. If it “seems” that markets would levitate forever, it’s the recency bias fooling you. Because the current bubble got so big, it just means, at least to me, that the potential downturn might be larger than a “normal” one of 30-50%. The current one is nearing an end, in my view – but what might trigger it? This will be clear only in retrospect, but here are some candidates:
- Inflation remains my top candidate, because it can (and will, I think) stop the Fed’s money-creation. Inflation has already surged this year – consumer inflation (CPI) to 5.3%, producer to 8.3%. We haven’t seen inflation this high in 30 years (and high and rising – since the 1970s). The Fed’s mandate is price stability (inflation target of 2%), but it has so far ignored it with its “transitory” rhetoric. But inflation isn’t transitory and hasn’t eased when the “base effect” ended. The Fed has already begun to signal tapering its bond-buying, maybe this year, while trying not to rock the boat. We think that inflation will re-accelerate beginning this month (reported in mid-October) and into the year-end. Even if price rises moderate, inflation might end the year at least around 6-6.5%.
- Evergrande/China: You have probably read this month about trouble at a Chinese conglomerate Evergrande. China’s second-largest property developer, with $300 billion in debt, has just defaulted on its debt payment. Downgraded and locked out of capital markets, it basically collapsed and unable to pay its 200,000 employees and its countless subcontractors. In the view of most observers, China is expected to bail it out as it presents large risk to China’s entire economy due to its size. But let’s be clear: China’s real estate is an enormous debt-fueled bubble. And Evergrande’s situation is a textbook milestone in its collapse – the same as US episodes with Bear Stearns in 2008 and WorldCom in 2001. In fact, it tells me that the bursting of China’s real estate bubble is well under way. It’s not a question of “whether” this will affect global markets. We’re already witnessing shockwaves in global markets. The only question is if the contagion will spread from China’s property bubble to other, global bubbles.
- US economic performance: After the stimulus-fueled rebound in the first half of 2021, the economy seems to have faltered so far in Q3. Retail sales, consumer confidence, and payrolls came in below expectations. Investors have so far ignored this, but continued weakness might draw their attention. Additionally, the post-pandemic housing boom may be ending. Home buying, building, and prices have surged on mass post-pandemic migration from cities. The Case-Shiller home price index surged by a record 20% in 12 months. There are signs that this trend is easing, including builder confidence and home sales. If prices begin to reverse, it could be significant and harm confidence.
About Model Capital Management LLC
Model Capital Management LLC (“MCM”) is an independent SEC-registered investment advisor, and is based in Wellesley, Massachusetts. Utilizing its fundamental, forward-looking approach to asset allocation, MCM provides asset management services that help other advisors implement its dynamic investment strategies designed to reduce significant downside risk. MCM is available to advisors on AssetMark, Envestnet, SMArtX, and other SMA/UMA platforms, but is not affiliated with those firms.
Notices and Disclosures
- This research document and all of the information contained in it (“MCM Research”) is the property of MCM. The Information set out in this communication is subject to copyright and may not be reproduced or disseminated, in whole or in part, without the express written permission of MCM. The trademarks and service marks contained in this document are the property of their respective owners. Third-party data providers make no warranties or representations relating to the accuracy, completeness, or timeliness of the data they provide and shall not have liability for any damages relating to such data.
- MCM does not provide individually tailored investment advice. MCM Research has been prepared without regard to the circumstances and objectives of those who receive it. MCM recommends that investors independently evaluate particular investments and strategies, and encourages investors to seek the advice of an investment adviser. The appropriateness of an investment or strategy will depend on an investor’s circumstances and objectives. The securities, instruments, or strategies discussed in MCM Research may not be suitable for all investors, and certain investors may not be eligible to purchase or participate in some or all of them. The value of and income from your investments may vary because of changes in securities/instruments prices, market indexes, or other factors. Past performance is not a guarantee of future performance, and not necessarily a guide to future performance. Estimates of future performance are based on assumptions that may not be realized.
- MCM Research is not an offer to buy or sell or the solicitation of an offer to buy or sell any security/instrument or to participate in any particular trading strategy. MCM does not analyze, follow, research or recommend individual companies or their securities. Employees of MCM may have investments in securities/instruments or derivatives of securities/instruments based on broad market indices included in MCM Research.
- MCM is not acting as a municipal advisor and the opinions or views contained in MCM Research are not intended to be, and do not constitute, advice within the meaning of Section 975 of the Dodd-Frank Wall Street Reform and Consumer Protection Act.
- MCM Research is based on public information. MCM makes every effort to use reliable, comprehensive information, but we make no representation that it is accurate or complete. We have no obligation to tell you when opinions or information in MCM Research change.
- MCM DOES NOT MAKE ANY EXPRESS OR IMPLIED WARRANTIES OR REPRESENTATIONS WITH RESPECT TO THIS MCM RESEARCH (OR THE RESULTS TO BE OBTAINED BY THE USE THEREOF), AND TO THE MAXIMUM EXTENT PERMITTED BY LAW, MCM HEREBY EXPRESSLY DISCLAIMS ALL WARRANTIES (INCLUDING, WITHOUT LIMITATION, ANY IMPLIED WARRANTIES OF ORIGINALITY, ACCURACY, TIMELINESS, NON-INFRINGEMENT, COMPLETENESS, MERCHANTABILITY AND/OR FITNESS FOR A PARTICULAR PURPOSE).
- “Model Return Forecast” for 6-month S&P 500 return is MCM’s measure of attractiveness of the U.S. equity market obtained by applying MCM’s proprietary statistical algorithm and historical data, but is not promissory, and, by itself, does not constitute an investment recommendation. Model Return Forecasts were calculated and applied by MCM to its research and investment process in real time beginning from 2012. For periods prior to Jan 2012, the results are “back-tested,” i.e., obtained by retroactively applying MCM’s algorithm and historical data available in Jan 2012 or thereafter. Source for the S&P 500 actual returns: S&P Dow Jones.
- Index returns referenced in MCM Research, if any, are gross of any advisory fees, fund management fees, and trading expenses. Fund or ETF returns referenced, if any, are gross of advisory fees and trading expenses. Returns will be reduced by fees and expenses incurred.
