
Stock market volatility can be stressful, even frightening. Investors tend to feel the stress of market declines more significantly than the euphoria of gains. Nobel prize winning work by behavioral economists Amos Tversky and Daniel Kahneman suggests that investors feel the pain of loss at least twice as much as the euphoria of gains. Importantly, when we feel the pain of loss, we often want to act on those emotions. This makes sense in that in many areas of life, acting to avoid pain is the best course of action.
When investing, acting on emotion is usually not a great idea. Volatility is part of equity investing and emotional responses to the inevitable stock market swings can hurt long-term investment returns. In fact, the equity market corrects or declines at least 10% roughly every 18 months. Most of those declines are quickly reversed.
Over the years, we have developed tools for managing risk in anticipation of recessions and systematic market breakdowns, including our Cash Indicator (CI). Our work suggests that it is only during periods of a heightened risk of a recession and/or a systematic market breakdown that market volatility is a sign of much more significant and prolonged losses to come. Our leading economic indicators and the CI can help us assess changing market dynamics through the lens of a disciplined and time-tested investment process. Reacting to market swings solely based on the emotional impacts of volatility without a well-defined process for acting, may result in locking in losses and forgoing gains.
Stock market volatility often coincides with headline risks. Today, we are seeing significant headline risk stemming from the evolving situation with Ukraine and Russia as well as the pending shifts in U.S. Federal Reserve (Fed) policy. It’s important to remember that over time, equity markets move in the direction of corporate earnings.
Humanitarian and other issues aside, events dealing with Russia outside of an all-out shooting war between the major global powers are not that economically impactful from a global perspective. Europe will face a larger economic impact as Russia is a major source of energy, especially for Germany. But otherwise, Russia is not a very big influence on the global economy. For example, according to the World Trade Organization (2019), Russia dropped over the course of 2008 to 2018 from 12th in terms of global trade in goods and services to 17th, just ahead of Switzerland and just behind Belgium. At the end of the day, the global economy will find a way to move forward with or without Russia’s engagement.
Domestically, continued economic momentum and strong jobs creation gives the Fed the green light for its anticipated policy pivot from supporting growth to taming inflation. Historically, Fed shifts to a tightening policy as well as geopolitical risks have caused equity market volatility. Outside of true recessionary environments, these shocks are short-lived and last 40 to 50 days on average before reversing over a similar period as the equity market pushes higher over time. As a recent example, the late 2018 equity market decline, which also did not reflect economic decline, lasted only about 90 days before reversing.
Our work suggests that the recent market volatility is normal and should be expected from the equity markets from time to time. As the following graph illustrates, crises come and go, yet the stock market continues higher. The major exceptions to this rule are when markets experience a systematic breakdown or as corporate earnings crash during economic recessions and stock prices follow suit.

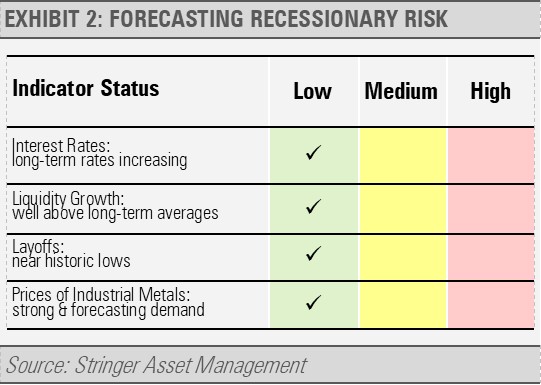
Currently, we see little risk of economic damage leading to a recession. Looking at our broad set of recessionary risk indicators, none are showing significant signs of risk. These datapoints cover a broad range of economic indicators, such as interest rates, liquidity growth, layoffs, and the trends in the price of industrial metals. This collection of tools has proved a reliable foundation for forecasting economic growth and contraction.
As the economy grows, businesses adapt to changing conditions, contributing to revenue and earnings growth. It is typically when the economy is showing signs of a recession that we become concerned about equity market volatility.
Similarly, our Cash Indicator (CI) has been useful for helping us judge potential volatility. The CI has moved from historically low levels in late 2021 to more moderate levels as more risk has been priced into the credit markets and equity markets. Combined with our strong fundamental view, the current CI level suggests that stock market declines in the near-term should represent buying opportunities.

Based on these factors and more, our work suggests that we should be optimistic about economic growth as well as the strength of the private sector including households and businesses. As a result, we think the recent equity market weakness will reverse in the coming weeks or months, and we view the recent market volatility as a buying opportunity.
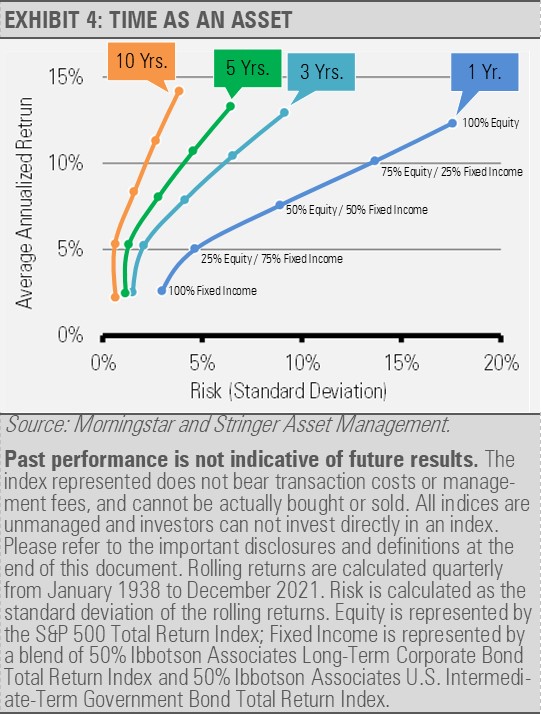
Situations like this are what we mean by time as an asset. Markets will experience periods of volatility from time to time. Still, as we observe longer time frames from daily, weekly, monthly, and annual, market swings become more muted the longer the time frame considered.
The World Trade Organization. (2019). World Trade Statistical Review 2019. Retrieved from https://www.wto.org/english/res_e/statis_e/wts2019_e/wts2019_e.pdf
DISCLOSURES
Any forecasts, figures, opinions or investment techniques and strategies explained are Stringer Asset Management, LLC’s as of the date of publication. They are considered to be accurate at the time of writing, but no warranty of accuracy is given and no liability in respect to error or omission is accepted. They are subject to change without reference or notification. The views contained herein are not be taken as an advice or a recommendation to buy or sell any investment and the material should not be relied upon as containing sufficient information to support an investment decision. It should be noted that the value of investments and the income from them may fluctuate in accordance with market conditions and taxation agreements and investors may not get back the full amount invested.
Past performance and yield may not be a reliable guide to future performance. Current performance may be higher or lower than the performance quoted.
The securities identified and described may not represent all of the securities purchased, sold or recommended for client accounts. The reader should not assume that an investment in the securities identified was or will be profitable.
Data is provided by various sources and prepared by Stringer Asset Management, LLC and has not been verified or audited by an independent accountant.
Index Definitions:
S&P 500 Index – This Index is a capitalization-weighted index of 500 stocks. The Index is designed to measure performance of a broad domestic economy through changes in the aggregate market value of 500 stocks representing all major industries.
Ibbotson Associates Long-Term Corporate Bond Index – This Index is comprised of the following performance numbers: total returns from 1969-present are represented by the Citigroup Long-Term High-Grade Corporate Bond Index. This Index includes nearly all Aaa- and Aa -rated bonds with at least 10 years to maturity. From 1926-1968 returns were calculated by summing the capital appreciation returns and the income returns. For the period 1946-1968, Ibbotson and Sinquefield backdated the Salomon Brothers’ index, using Salomon’s monthly yield data with a methodology similar to that used for 1969-present. For the period 1926-1945, Standard and Poor’s monthly High-Grade Corporate Composite yield data were used, assuming a four percent coupon and a 20-year maturity. The conventional present-value formula for bond price was used for the beginning and end-of-month prices.
Ibbotson Associates U.S. Intermediate-Term Government Bond Index – This Index is comprised of the following performance numbers: total returns for the 1987-present period are calculated from the Wall Street Journal prices using the coupon accrual method. Returns over 1934-1986 are obtained from the CRSP Government Bond File. From 1934-1942, almost all bonds with maturities near five years were partially or fully tax-exempt and selected using the rules described above. From 1926-1933, there are few bonds suitable for construction of a series with a five year maturity. For this period, five-year bond yield estimates are used. These estimates are obtained from Thomas S. Coleman, Lawrence Fisher, and Roger G. Ibbotson.
