
Our work suggests that U.S. economic prospects continue to brighten. Higher long-term interest rates currently reflect market expectations for faster economic growth and somewhat higher inflation. We expect the trend towards higher interest rates to continue in fits and starts. As the following graph illustrates, long-term interest rates tend to rise significantly more than short-term interest rates during the initial stages of an economic recovery, which is known as yield curve steepening and is a very positive signal. This is especially true relative to the yield curve inversion we witnessed almost two years ago when long-term interest rates dipped below short-term rates. Still, with each successive business cycle over the last 40 years, the peak in long-term interest rates has been below the peak of the previous cycle. We believe that this trend is due to fundamental factors, such as an aging population, that remain in effect. This phenomenon should limit how high long-term interest rates will eventually go.

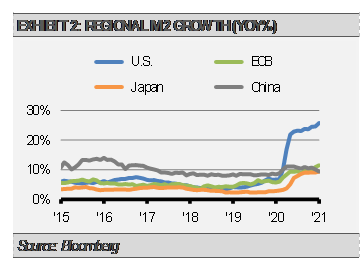
Likewise, liquidity growth, especially in the U.S., indicates a positive backdrop for economic growth. For an economy to grow, there must be enough liquidity growth in the economy to facilitate lending and transactions. As the graph below illustrates, liquidity growth in the U.S. as measured by M2, which includes cash, checking deposits, and short-term time deposits such as CDs, has grown much more quickly over the past year than in other major economies.
Furthermore, improvements in U.S. leading economic indicators suggest more growth ahead. One of our more potent leading economic indicators is the combination of automobile manufacturing and residential investment as a percentage of economic activity. As the following graph illustrates, this indicator has not only turned solidly positive but still has a long way to go to match previous cycles. Importantly, this is all before any additional stimulus is factored into the equation.

We have increased our forecast for U.S. GDP growth and expect higher interest rates as a result of these factors. Though we expect bouts of market volatility, the underlying trends should remain positive. Therefore, we have positioned our Strategies for continued higher long-term interest rates with the expectation that cyclical equity sectors will outperform the broad market and any equity market declines are likely buying opportunities.
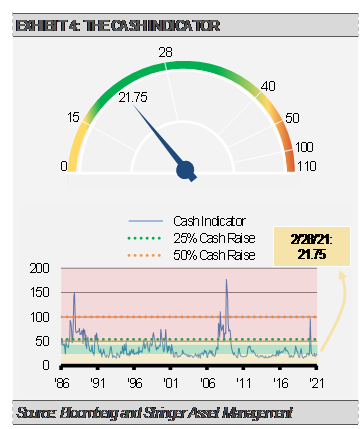
The Cast Indicator
The Cash Indicator (CI) has been useful for helping us judge potential volatility. The CI level remains constructive and reflects that markets are operating in normal ranges of volatility and correlation.
DISCLOSURES
Any forecasts, figures, opinions or investment techniques and strategies explained are Stringer Asset Management, LLC’s as of the date of publication. They are considered to be accurate at the time of writing, but no warranty of accuracy is given and no liability in respect to error or omission is accepted. They are subject to change without reference or notification. The views contained herein are not to be taken as advice or a recommendation to buy or sell any investment and the material should not be relied upon as containing sufficient information to support an investment decision. It should be noted that the value of investments and the income from them may fluctuate in accordance with market conditions and taxation agreements and investors may not get back the full amount invested.
Past performance and yield may not be a reliable guide to future performance. Current performance may be higher or lower than the performance quoted.
The securities identified and described may not represent all of the securities purchased, sold or recommended for client accounts. The reader should not assume that an investment in the securities identified was or will be profitable.
Data is provided by various sources and prepared by Stringer Asset Management, LLC and has not been verified or audited by an independent accountant.
