Economic Overview
 Inflation remained the topic du jour during May, with no let-up in high prices in sight. Both Federal Reserve officials and more recently Treasury Secretary Yellen have owned up to getting the inflation picture wrong. As something that punishes lower income workers more than the well-off, inflation is the single most important political issue ahead of the November mid-term elections.
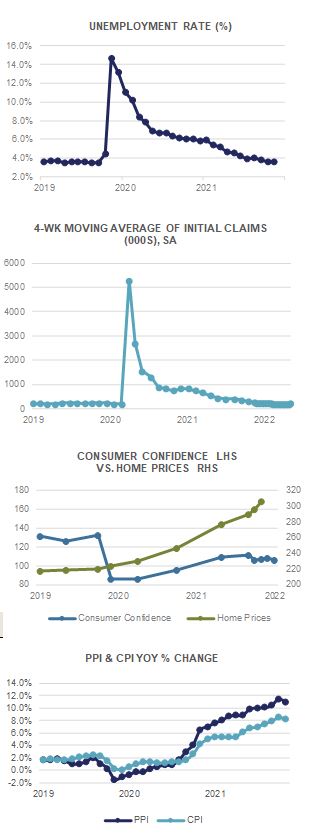
The Consumer Price Index for April rose +0.3% MoM while Core PPI (ex Food & Energy) surged +0.6%. This translates into +8.3% and +6.2% YoY increases, among the highest seen in 40 years. Producer Prices rose +0.5% MoM with Core PPI up +0.4% (equaling +11.0% and +8.8% respectively YoY). The PCE Deflator rose +0.2% in April (+6.3% YoY) while the PCE Core Deflator edged up +0.3% (+4.9% YoY). With energy prices remaining high thanks largely to the Russia/Ukraine war and China’s “zero Covid” policy continuing to hinder global supply chains, both energy and consumer goods prices are likely to remain elevated for some time ahead.
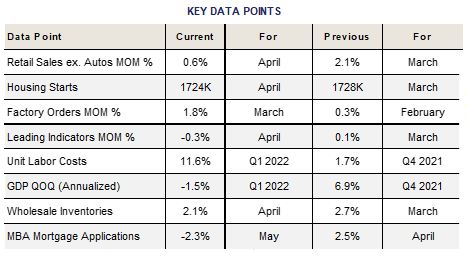
On the labor front, Average Hourly Earnings rose +0.3% in April and are now up +5.5% YoY. The Unemployment Rate came in at 3.6% while the latest JOLTS Job Openings survey shows 11,400k jobs available currently (a slight downtick from last month’s all-time high of 11,855k). Initial Jobless Claims averaged 208k in May, with Continuing Claims hovering around the 1,347k level. The Labor Force Participation Rate remains low at 62.2%, and large urban companies continue to struggle with “return to office” mandates.
Despite higher interest rates (and hence mortgage rates), the housing market remains robust. The notoriously busy spring buying & selling season has been plagued by low inventory, highlighting the fundamental mismatch between the supply of and demand for single family housing in the U.S. Housing Starts fell -0.2% MoM in April while Building Permits dropped -3.2%. New Home Sales tumbled -16.6% MoM while Existing Home Sales fell -2.4% and Pending Home Sales fell -3.9%. Long-term mortgage rates above 5% have further reduced affordability, while a 2.42% MoM uptick in the S&P CoreLogic 20-City Price index (+21.2% YoY!) didn’t help new home buyers either.
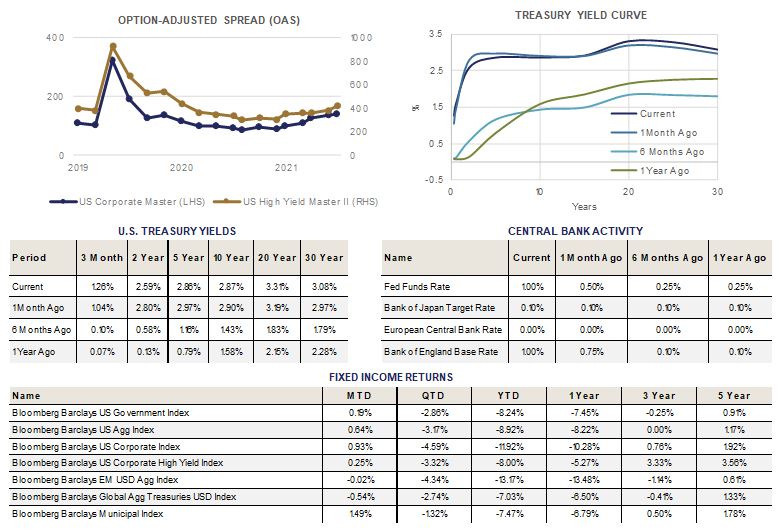
The Federal Reserve meets again June 15th and another 50 basis point hike in the Fed Funds rate is expected. The FOMC also should announce the beginning of balance sheet reduction. Despite the recent market trend towards lower interest rates, we would expect these actions to put further upward pressure on Treasury rates, taking the 10-year back towards the 3.00% level. With inflationary pressures unlikely to recede any time soon, more hawkish rhetoric from Fed officials may become the order of the day.
Domestic Equity
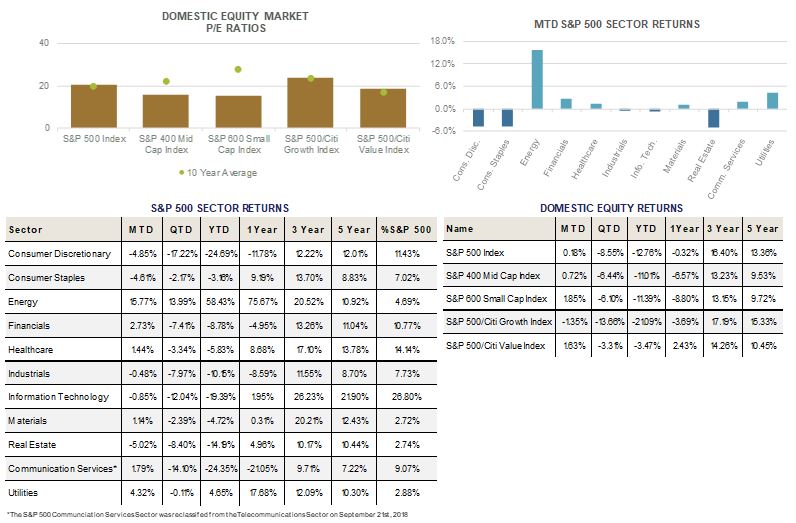
U.S equities had a volatile month of May, but ended the month with positive gains. The S&P 500 fell as much as -5% intra-month, before staging a sharp +9% intra-month rally. When the dust settled, the benchmark S&P 500 gained +0.18% to close at 4,132. Mid- and Small-Caps, as measured by the S&P 400 and 600 Indices, fared better, posting gains of +0.75% and +1.86%, respectively on the month. For the year, SMID-Caps have fared slightly better than Large-Caps, helped by less exposure to Technology and Growth oriented names. Mid- and Small-Caps have lost -10.98% and -11.37%, on the year, compared to -12.76% for the S&P 500.
From a style standpoint, Value stocks continue to outpace Growth stocks, with the S&P 500 Value Index gaining +1.64% during the period, and returning -3.46% year to date. That compares to the S&P 500 Growth Index, which lost -1.36% on the month, and has returned -21.09% year to date. The nearly 18 percentage point difference between Value and Growth stocks comes as interest rates have risen sharply and Technology and other Mega-Cap Growth stocks have been hard hit.
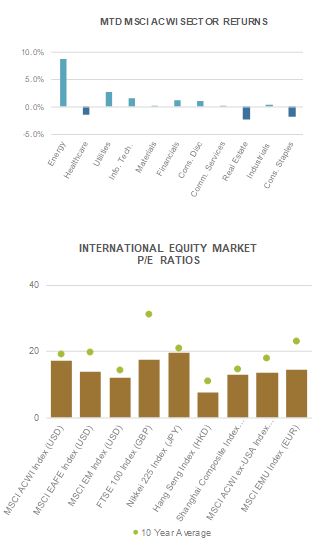
The Value versus Growth dichotomy is best seen at the sector level, which has seen performance dominated by those Value oriented sectors benefitting from higher interest rates, commodity prices, and defensive characteristics. Energy, Utilities, and Financials were the top performing sectors in May, returning +15.77%, +4.32%, and +2.73%, respectively. Bottom performers included Real Estate, Consumer Discretionary, and Consumer Staples, which respectively lost -5.02%, -4.85%, and -4.61%. For the year, Energy remains the top performing sector, up a staggering +58.43%, followed by Utilities, which have gained +4.65%. Bottom performers include Technology (-19.39%), Communication Services (-24.35%), and Consumer Discretionary (-24.69%), all sectors home to the largest companies (i.e. FAAMG; Facebook, Apple, Amazon, Microsoft, Google) in the index. From a valuation standpoint, Utilities have proven their worth year to date, posting strong absolute and relative performance compared to the broad market; however, forward valuations remain elevated and look less appealing than similarly yielding alternatives (i.e. corporate bonds).
Much has been written, published, and debated around the health of the consumer and whether or not the U.S. economy is in or near a recession. With rising inflation, decreased confidence and spending, and much of the pandemic-era savings surplus exhausted, recent performance of Consumer related sectors and companies has been mixed, but bears watching moving forward. Small-Caps have likely priced in some of this recession and consumer slowdown risk, given their revenue exposure to the U.S. economy, and higher degree of cyclicality when compared to Large-Caps. With valuations on the S&P 600 currently trading at multi-year absolute and relative (to Large) lows, long-term return prospects look attractive, while bottoms up earnings estimates continue to rise.
International Equity
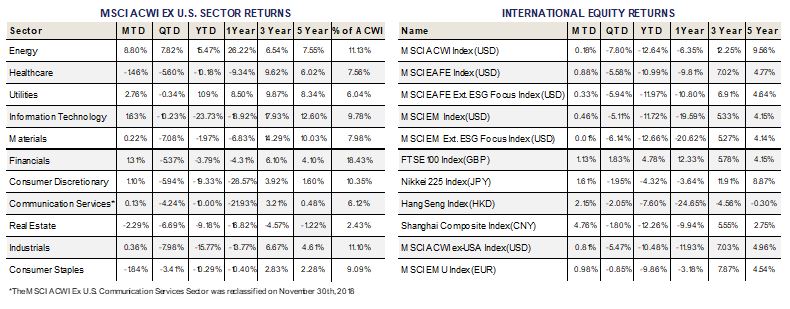
 International equities also posted positive returns on the month, following the S&P 500 higher. Both Developed Markets (DM) and Emerging Markets (EM) equities rose on the month, despite a plethora of headwinds. DM, as measured by the MSCI EAFE Index, was the top performer in May, rising +0.88%, while EM, as measured by the MSCI EM Index gained +0.46%. EM equities rallied sharply into the end of the month as China announced restrictions in Shanghai would ease, meaning one of China’s most populous cities could begin exiting a nearly two-month lockdown. While Shanghai’s re-opening does not signal an end to President Xi’s “Zero Covid” policy, it nonetheless represents a turning point and incremental positivity towards Chinese equities. Chinese equities have been hard hit over the past year, with the MSCI China rallying to close the month positive after being down -10%. The index is down -16.19% year to date. China represents nearly 1/3 of the EM Index, clearly the anchor in terms of overall performance. While incremental momentum is indeed welcome news, China’s economy remains in a slowdown as a result of the severe lockdowns. 2022 may represent the first time in decades where the U.S. economy grows faster than China, putting pressure on President Xi to do more to stimulate growth ahead of his Fall re-election campaign. Stay tuned.
DM equities held their own in May, despite the ongoing war in Ukraine and rising inflation in Europe. DM equities are down -10.99% year to date, slightly better than the S&P 500, which is down -12.76% over the same time period. Breaking down the Index further reveals shifts in policy mix that has key ramifications for investors.
In Europe, the European Central Bank (ECB) announced its intent to raise their benchmark interest rate into positive territory in September. This would be a symbolic milestone and turn the page on “Negative Interest Rate Policy” (NIRP), which is widely viewed as a wonky experiment that didn’t help the bloc much. The key takeaway from this announcement is that Eurozone country yields (i.e. Germany) are likely moving higher as inflation rises and the ECB remains farthest behind the curve. This could put upward pressure on the Euro versus the Dollar, but ultimately time will tell if other factors (i.e. Russia, recession) take center stage.
In Japan, the Bank of Japan (BoJ) remained steadfast in its commitment to “Yield Curve Control” (YCC), namely a policy to purchase unlimited amounts of Japanese Government Bonds (JGB’s) at a defined level. This has put significant downward pressure on the Yen versus the Dollar as interest differentials have diverged significantly. Japan has not seen (yet) the kinds of inflation the rest of the world has, but at some point, they likely will have to reverse course. Nailing the dismount could prove challenging, just like it has to most other major global central banks.
In the U.K., high energy prices and soaring inflation have put a damper on consumption, and led to a special tax on Oil and Gas profits by the Government. On top of that, the U.K. is still dealing with Brexit issues nearly 6 years after voting, adding to the uncertainty around U.K. equities.
Fixed Income
For a change of pace, the yield curve ended May very close to where it began the month. Treasury yields were flat to slightly lower for most maturities, and domestic fixed income returns were broadly positive.
This relative stability likely reflects a swift change in Federal Reserve expectations. The market had been expecting an extremely aggressive series of rate hikes to fight inflation. Through the month, concerns of a possible economic slowdown/recession became more pronounced. As these concerns grew, expectations for Fed hikes softened a bit, with talk of a “pause” in September once the Fed has increased the upper bound of its policy rate to 2%.
This growing expectation has fueled a risk-on move in the markets, with credit spreads tightening and equities rallying. The overlooked qualification for a pause is that the Fed will be looking for ‘clear and convincing’ evidence of slowing inflation. If this has not materialized before the September meeting, it will be difficult for Chairperson Powell to justify pausing, and potentially falling (further) behind in the fight against inflation.
Investment grade credit spreads widened for the first three weeks of May before tightening through month end. The tightening was significant enough to completely reverse the widening experienced earlier in the month. This allowed investment grade corporate bonds to have a very strong showing in May, returning almost 1%.
High Yield spreads followed a similar pattern, widening before ending the month strong and providing positive performance in May.
Municipal bonds were the clear winner in May, outperforming as their yields declined sharply as a percentage of Treasury yields. This performance also occurred late in the month. After underperforming for most of the month, muni bonds rallied during the final 10 days to end higher in May and leading the way in performance with a 1.49% return.
The sentiment swing to risk-on in the fixed income market rewarded investors who held credit risk in their portfolios. This risk tailwind left Treasuries with a positive return for the month, but trailing the other domestic benchmarks. May’s positive fixed income returns provided a welcome respite from the difficult environment for bonds so far in 2022.
Alternative Investments
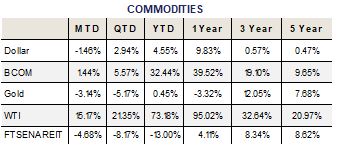
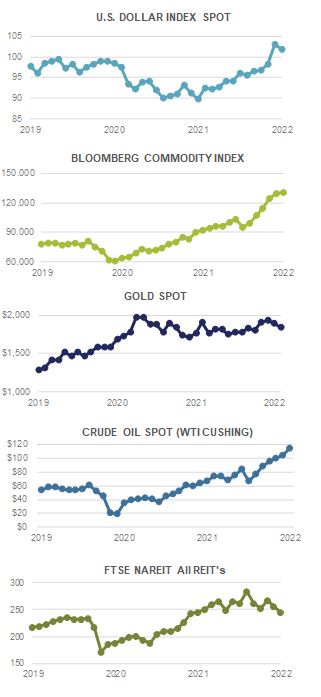 Alternative investments had mixed results in May, with a slightly weaker US Dollar helping some commodities. The Bloomberg Commodity Index finished the month up +1.44% and is up +32.44% YTD.
Energy continued to dominate news headlines during the month, as the EU struck a deal to ban most Russian oil imports by the end of the year. These measures announced on May 30th aim to reduce Russian oil imports to the EU by about 90% by the end of the year. However, there is a temporary exemption for imports by pipeline as Hungary fought to protect their economic interests due to their reliance on Russian energy and landlocked status.
The price of WTI crude oil skyrocketed during the month, rising over +15%, as the price of oil closed at $114.67 per barrel at month end. The lack of supply remains a major issue as oil refineries can’t ramp up production fast enough due to a shortage of processing capacity and lower investment over the past few years. The supply constraints also coincide with higher demand for fuel in the upcoming summer travel months and as China begins to ease lockdown restrictions in Shanghai.
Higher oil prices have been passed on to the consumer, with the national average gas price reaching $4.62 per gallon in the US at the end of May. With inflation at a 40 year high, the average American consumer is being hurt by higher prices across nearly all aspects of their daily life.
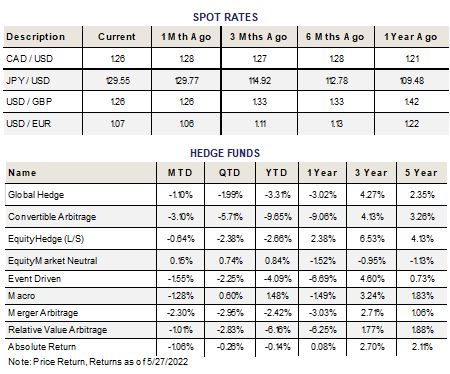
Hedge fund strategies had mainly negative results during the month, with eight out of nine strategies tracked posting negative returns on average. Equity Market Neutral strategies were the top performer for May, finishing up a scant +0.15%. Equity Market Neutral and Macro strategies are the top performing strategies for the year and the only strategies tracked in positive territory YTD.
ESG
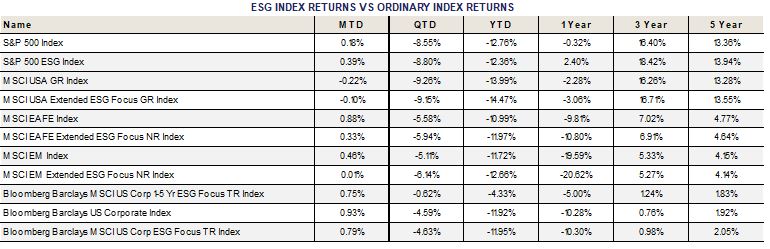
 2022 returns for the ESG equity indices have seen continued volatility. Fossil fuel exposures, which are underweight or nonexistent in many ESG vehicles, have performed extremely well year to date given the rally in energy prices due to Russia’s war in Ukraine, and the resulting reduction of access, trade restrictions, and sanctions.
This is quite a reversal from the expectations not long ago that fossil fuel needs would continue to decline as the transition to green energy and electrification gained steam. The pandemic, economic shutdowns, and renewed geopolitical tensions have delayed the timeline for transition off of fossil fuels.
This is apparent in the European Commission’s plan to sell between 200mn and 250mn Emission Trading System (ETS) certificates from a so-called Market Stability Reserve. These certificates allow for CO2 emissions from power stations, energy-intensive industries (e.g. oil refineries, steelworks, and producers of iron, aluminum, cement, paper, and glass) and civil aviation. These companies can be fined if they emit more CO2 than they have emission allowances for. The EU expects the proceeds of the sale to help speed the transition away from Russian fossil fuels.
In May, the U.S. ESG integrated index outperformed its benchmark while the EAFE ESG and the Emerging Markets ESG indices trailed their respective benchmarks. ESG integrated Fixed Income also underperformed its non-ESG integrated counterpart.
The ESG aligned U.S. index outperformed its non-ESG counterpart by 21 basis points in the month. Year to date it has outperformed by 40 basis points. One, three, and five year time periods are all strongly additive to performance compared to the non-ESG aligned benchmark.
ESG integrated EAFE returns experienced 55 basis points of underperformance in May. Year to date, the performance of ESG integrated EAFE trailed its benchmark by 98 basis points. Three year and five year time periods trail non-ESG marginally. This allocation has traditionally had the hardest time outperforming its non-ESG integrated benchmark, and that trend has continued.
Emerging Markets ESG equity performance lagged its benchmark by 45 basis points in May, reverting from what had been a strong track record of being accretive to performance. The year to date number is similar to the EAFE ESG results, showing 94 basis points of underperformance. Longer time horizons show results very close to breakeven compared to the non-ESG benchmark.
ESG integrated Investment Grade corporate bonds underperformed their non-ESG equivalent by 14 basis points in May. Year to date ESG integrated IG bonds are 3 basis points behind their benchmark. The three year and five year time periods remain supportive of ESG integration into fixed income portfolios as this index continues to show positive returns over its benchmark.