Economic Overview
November 1, 2020
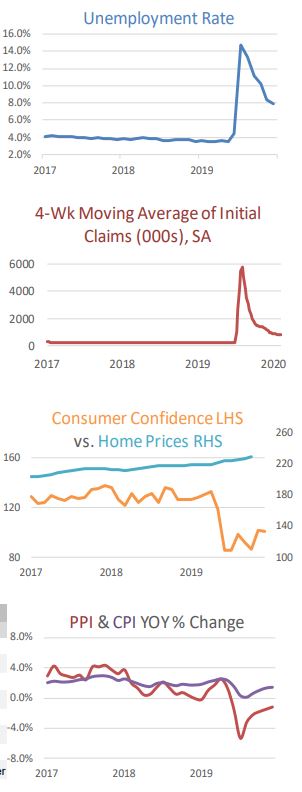
As expected, the Advance Estimate for third quarter US Gross Domestic Product showed a massive rebound from Q2’s Covidinduced collapse. GDP rose at a 33.1% annual rate, on the heals of Q2’s stunning -31.4% annualized decline. The data would seem to indicate the US is poised for more of a V-shaped economic recovery, although the divide between winners (tech) and losers (travel & entertainment) continues to widen.
On the eve of a potentially historic political election day, the US economy continues to grapple with pandemic-related challenges, with no clear solution in sight, short of a widely available and effective vaccine. Despite the obstacles to a smoothly running economy, massive fiscal and monetary stimulus has prompted a quicker than expected recovery in housing and manufacturing, and nearly all things tech.
Despite a small MoM drop in New Home Sales in September, Existing Home Sales rose a better than expected +9.4% while Building Permits surged +5.2% MoM and Mortgage Applications continued to rise. Mortgage rates remained near historically low levels and the burgeoning millennial cohort is turning towards single-family housing, spurred on by the pandemic.
Inflation, as measured by the Consumer Price Index, remained tame, with the September CPI rising +0.2% MoM (+1.4% YoY), while producer prices gained +0.4% MoM (and only +0.4% YoY). Declines in energy prices, as well as rents, helped keep overall inflation levels in check.
The Federal Reserve’s FOMC meets this week and it’s widely expected they will keep the Fed Funds rate at the zero-bound. Investors will be looking for any hint of potential policy change following the election results, should they be known by the time of the meeting. All bets are currently for a spike in volatility as we grind our way through this week.
Domestic Equity
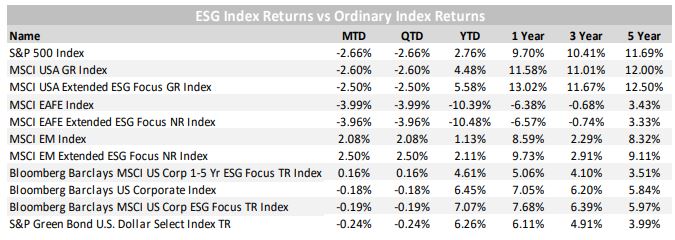
U.S. equities fell sharply last week, with the benchmark S&P 500 Index losing -5.6% to close the month at 3,269. For the month, Large-Caps posted a -2.66% decline and now are barely in positive territory for the year, up a scant +1.2%; however, given the uncertainties 2020 has presented, and on the eve of one of the most consequential elections in recent memory, the fact that the S&P 500 is in positive territory could be viewed as surprising on its own.
Mid- and Small-Caps on the other hand fared much better in October, with the S&P MidCap 400 Index gaining +2.17% and the S&P SmallCap 600 Index gaining +2.57%. While smaller companies have largely been left behind this year (Mid- and Small-Caps are down -6.63% and -13.08%, respectively), they have recently showed signs of life as prospects for additional economic stimulus come into focus.
Value outperformed Growth, with the S&P 500 Citi Value Index losing -2.00% compared to the S&P 500 Citi Growth Index which shed -3.08%. For the year, Growth remains dominant, up +16.89% versus -13.24% for Value.
From a sector standpoint, earnings from the world’s largest Technology (and similarly related) companies disappointed last week, despite many revenue and earnings beats. The selloff is likely more of a function of how stock prices for Facebook, Apple, Amazon, Microsoft and Google (collectively FAAMG) have soared in 2020 as beneficiaries of the current pandemic. For the month of October, the Technology sector (Apple, Microsoft) shed -5.10% while Consumer Discretionary (Amazon) lost a more modest -2.93%. Communication Services (Facebook, Google) was actually positive by +0.79% thanks to a favorable reaction from investors towards Google, despite negative sentiment towards Facebook.
On a brighter note, Utilities were firmly in the black during the month, gaining +5.04%, handily outpacing the broad -2.66% decline in the market. Interestingly, Utilities still remain in negative territory for the year down -0.93%, despite their attractive valuation and yield relative to other parts of the market.
With the economy continuing to recover, a continued rotation into Value, Small-Caps, and cyclical sectors may be on the horizon.
International Equity
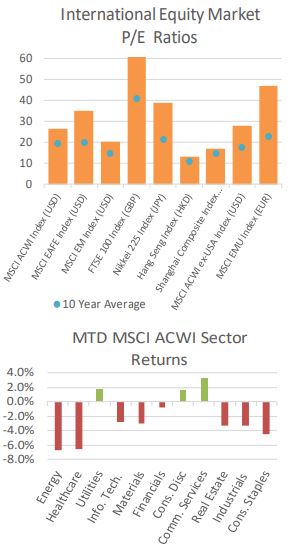
International equities were a mixed bag in October with Developed Markets (DM), as measured by the MSCI EAFE Index, down -3.99%. On the other hand, Emerging Markets (EM), as measured by the MSCI EM Index rose +2.08% as continued economic strength emanates from Asia. For the year, EM (+1.13%) continues to outpace DM (-10.39%) by a wide margin.
In Developed Markets, worries persist around recent Covid outbreaks in Europe, with newly imposed restrictions announced in the past week in France, Germany, and the United Kingdom. With lockdowns imposed in France and the U.K., Germany took a more measured approach and closed bars and restaurants, amongst others. Regardless, the headlines and Covid related data remain weak and worrisome for all of Europe.
In Emerging Markets, China continues to rebound and power economic growth in the region. The upcoming initial public offering (IPO) of Alibaba affiliated Ant Group is expected on November 5th and should be the largest IPO on record at more than $34B. The IPO is slated as a dual listing in Hong Kong and Shenzhen (on the newly formed STAR board) which is akin to the NASDAQ in the U.S. Investor excitement over Ant, as well as improving absolute and relative fundamentals continue to power Emerging Markets and buoy their local currencies.
From a sector standpoint, MSCI ACWI ex US Communication Services, Utilities, and Consumer Discretionary posted positive returns on the month, up +3.27%, +1.72%, and +1.57%, respectively. Laggards included Energy, Healthcare, and Staples, down -6.69%, -6.46%, and -4.48%, respectively. For the year, Technology remains the top performer up +13.76%, while Energy remains the worst performer, down -41.22% YTD.
Looking at specific countries, Japan has served as a safe haven within DM, with the Nikkei 225 Index (in JPY) giving back only -0.90% in November. For the year, Japanese equities are down -1.15%, a sharp contrast to its DM peers. In EM, China remains firmly in the black, with the Shanghai Composite (in CNY) gaining +0.22% on the month, and +8.19% on the year to outperform most other DM and EM countries alike.
Fixed Income
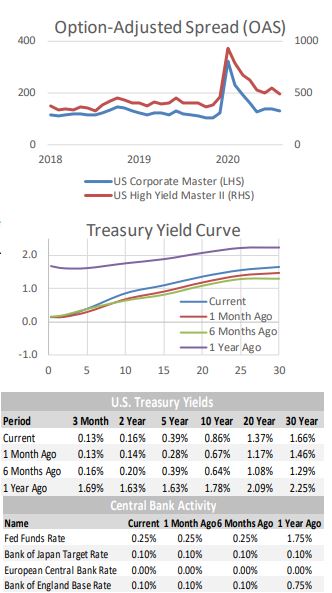
Fed Chairperson Jerome Powell is likely to renew his call for additional fiscal stimulus during this week’s meeting. While he has said there are additional avenues of stimulus that the Fed could pursue, including larger asset purchases, he does not currently feel that it is appropriate to ramp up monetary stimulus further. This allows him to keep some monetary stimulus in reserve to battle potential future issues.
Fiscal stimulus talks are on hold as the country awaits the Presidential election results. Whatever the outcome of the election, significant fiscal stimulus is expected to be a top priority. High unemployment and concern about re-skilling those who have been impacted the most by the pandemic recession should provide support for an infrastructure bill. Repair what we have, construct what we need, and develop our skilled-trades while we’re doing so.
Treasury bond yields increased during October. This move made the Government Index the worst performer of the month, and was a drag on the performance of the Aggregate Index. After a couple months of credit spreads creeping wider, they reversed course in October. Investment Grade spreads fell by ~10 bps, providing a performance tailwind and offsetting some of the effect of rising Treasury yields, netting near breakeven performance. High Yield spreads were choppier, but ended up ~18 bps lower. The additional yield offered by Corporate bonds combined with the spread contraction in October resulted in attractive performance to kick off the fourth quarter.
Tax-free Municipal bond yields continue to look attractive compared to similar maturity Treasury bonds. As with Corporate bonds, sector exposures are important to manage risk. Issuers that are particularly affected by the pandemic skewed environment should be underweighted. Longer maturity tax-free Munis currently offer yields in excess of Treasury bond yields, which is anomalous. Even more so considering the proposed tax increases of the Biden campaign. While the election remains up in the air, owning tax-free bonds provides a nice hedge against less accommodative tax brackets in the future.
Alternative Investments
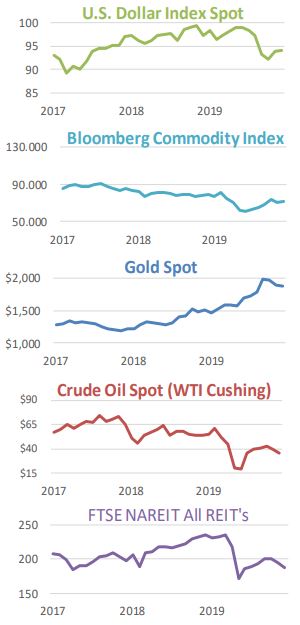
Alternative investments were a mixed bag during October. The Bloomberg Commodities Index was up +1.40% for the month despite the US Dollar having slightly positive performance (ie, a stronger Dollar usually hurts Commodities).
WTI Crude Oil was one of the worst performing alternatives for the month, returning -11.55% and closing at $35.79/barrel on the NYMEX. Lower energy demand from renewed COVID-19 restrictions and pent-up supply have put pressure on oil prices to remain low. Gold was down -0.37% for the month, but is still up +24.66% YTD. Low interest rates, a weak dollar, and falling real yields have helped the precious metal be one of the top performing asset classes in 2020.
Real estate, as measured by the FTSE NAREIT All REIT Index, fell -3.35% during the month and is down -15.21% YTD. Although the broad Real Estate market has been weak, certain subsectors such Cell Towers, Data Centers, and E-Commerce Logistics Warehouses have been standout winners. These growth-oriented segments of the market should remain beneficiaries of the continued rise of e-commerce, the 5G network buildout, increased mobile data usage, as well as other factors.
Volatility, as measured by the CBOE VIX Index, increased significantly throughout October to close the month at 38.02, well above its long-term average. Rising coronavirus cases, the upcoming election, and a lack of clarity around more stimulus have all played in a role in creating high levels of volatility.
Hedge Fund strategies posted mixed results during the month, with 5 of 9 strategies tracked posting slightly positive returns. Convertible Arbitrage was the top performer for the month, and remains the top performer YTD, being up +9.16%. Equity Market Neutral is the worst performing strategy for the year, down -6.66% YTD. This is surprising given that market neutral funds are intended to mitigate market risk and provide positive performance regardless of market conditions.
ESG
The Department of Labor’s proposed crackdown on ESG investments within ERISA retirement plans has been walked back significantly after the incredible pushback that was shared during the rule’s comment period. A whopping 94% of all comments submitted regarding the proposed rule were in opposition to the generalized attack on investments that integrate ESG concerns and the risk & return implications of doing so.
It is likely that the rule may be further watered down or scrapped altogether if the Presidential election goes Joe Biden’s way, as his campaign has been very supportive of Green and Social investment goals.
It is not difficult to understand why the rule was weakened, as we see continued outperformance by the broad ESG indexes and ESG mangers. These strategies have continued to see significant investor interest and receive a large proportion of investment flows. By July of 2020, ESG fund inflows had already eclipsed their total for all of 2019 and were on their way to another record-breaking year of asset gathering. According to Jon Hale of Morningstar, in September, 24% of all U.S. stock and bond fund inflows were allocated to ESG strategies.
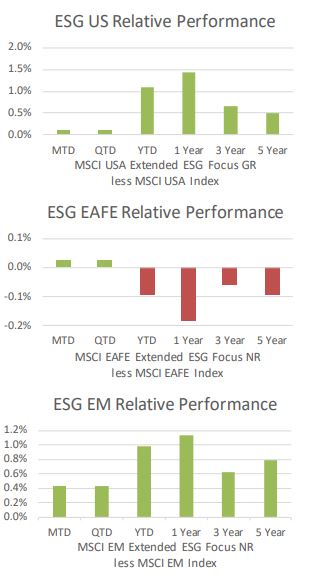
The MSCI USA Extended ESG Focus Index has continued to perform well, outperforming the MSCI USA Index by 90 bps YTD. The MSCI EAFE Extended ESG Focus Index was up 4 bps over the MSCI EAFE Index in October, although longer-term returns continue to lag slightly. MSCI EM Extended ESG Focus Index continues its streak of strong performance over the MSCI EM Index, highly additive across all time periods.
If you have any questions or comments, please feel free to contact any member of our investment team:
Tom Quealy, Chief Executive Officer – [email protected]
Larry Whistler, CFA, President/Chief Investment Officer – [email protected]
Nick Verbanic, CFP® V.P./Portfolio Manager – [email protected]
Matthew Krajna, CFA, Senior Portfolio Manager, Director of Equity Research –
[email protected]
Tim Calkins, CFA, Senior Portfolio Manager, Director of Fixed Income – [email protected]
Nick DiRienzo, CFA, Director of Operations – [email protected]
Mike Skrzypczyk, Senior Trader/Associate Portfolio Manager – [email protected]
Angila Snediker, Trading Associate – [email protected]
Nottingham Advisors, Inc. (“Nottingham”) is an SEC registered investment adviser with its principal place of business in the State of New York. Nottingham and its representatives are in compliance with the current registration requirements imposed upon registered investment advisers by those states in which Nottingham maintains clients. Nottingham may only transact business in those states in which it is registered, or qualifies for an exemption or exclusion from registration requirements. This material is limited to the dissemination of general information pertaining to Nottingham’s investment advisory/management services. Any subsequent, direct
communication by Nottingham with a prospective client shall be conducted by a representative that is either registered or qualifies for an exemption or exclusion from registration in the state where the prospective client resides.
The information contained herein should not be construed as personalized investment advice. Past performance is no guarantee of future results. Information contained herein should not be considered as a solicitation to buy or sell any security. Investing in the stock market involves the risk of loss, including loss of principal invested, and may not be suitable for all investors. This material contains certain forward-looking statements which indicate future possibilities. Actual results may differ materially from the expectations portrayed in such forward-looking statements. As such, there is no guarantee that any views and opinions expressed in this letter will come to pass. Additionally, this material contains information derived from third party sources. Although we believe these sources to be reliable, we make no representations as to the accuracy of any information prepared by any unaffiliated third party incorporated herein, and take no responsibility therefore. All expressions of opinion reflect the judgment of the authors as of the date of publication and are subject to change without prior notice. Past performance is not an indication of future results.
The indices referenced in the Nottingham Monthly Market Wrap are unmanaged and cannot be invested in directly. The returns of these indices do not reflect any investment management fees or transaction expenses. Had these additional fees and expenses been reflected, the returns of these indices would have been lower. Information herein has been obtained from third party sources that are believed to be reliable; however, the accuracy of the data is not guaranteed by Nottingham Advisors. The content of this report is as current as of the date indicated and is subject to change without notice.
For information pertaining to the registration status of Nottingham, please contact Nottingham or refer to the Investment Adviser Public Disclosure web site (www.adviserinfo.sec.gov). For additional information about Nottingham, including fees and services, send for our disclosure statement as set forth on Form ADV from Nottingham using the contact information herein. Please read the disclosure statement carefully before you invest or send money.


