
One of the reasons we formed RBA in 2009 was we thought the US was entering perhaps the biggest bull market of our careers. Our view was highly contrarian, to say the least, because the combination of a decade of emerging markets outperforming and the global financial crisis made investors extremely fearful of the US stock market.
Sentiment in the early-2010s was so extreme that people were hesitant to invest with RBA simply because we were too bullish. Our marketing materials at the time discussed what we called “fire extinguishers,” a metaphor for strategies we would employ if the US market imploded.
Even in 2014, five years into the bull market, we wrote an Insights report titled “Are you tired of being scared yet?” in which we highlighted how there was an overwhelmingly bearish consensus by listing 50 different reasons stock market observers cited for avoiding the US market.
Through the past decade, investors have displayed a remarkable shift in sentiment. Cautious investors who refused to invest in US and only wanted “safe” income turned into investors with an unquenchable thirst for the riskiest investments such as meme stocks, speculative small cap tech stocks, SPACs, and cryptocurrencies.
Despite the bear market in these extremely speculative assets, investors today are confused by our willingness to invest outside the US when the investment opportunities outside the US seem to be growing.
When investing internationally, it’s not simply about countries
Investors seem geographically myopic and unaware of a significant shift in the relative performance of some global markets. Whereas investors are waiting for the resurgence of US Technology, Communications, and Consumer Discretionary sectors, world stock market returns have become increasingly competitive to US returns.
Some non-US markets have outperformed despite a very strong US dollar. If the USD depreciates versus other currencies during 2023, then non-US investments (both equities and fixed-income) could become even more attractive to US investors. The ACWI ex US ETF currently has an indicated dividend yield of about 3.6%. If the USD were to depreciate by 10%, that would imply non-US stocks would offer a dividend yield of about 4% to US investors.
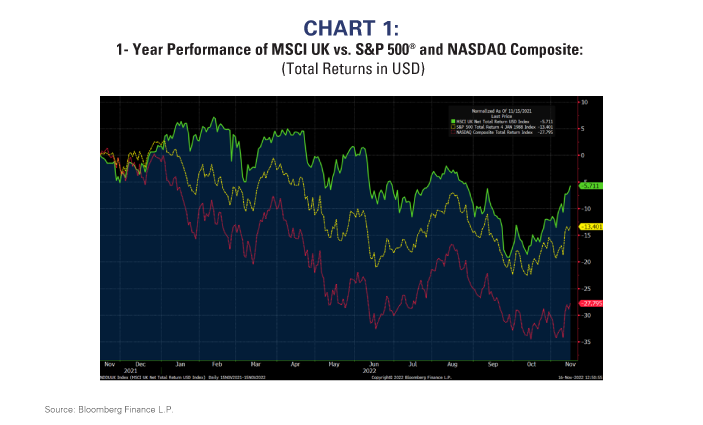
Despite the political turmoil in the UK during 2022, the UK stock market has handily outperformed the S&P 500® and NASDAQ (Chart 1). In US dollar terms, the UK is down only about 6% (from 11/15/21 to 11/15/22) versus about -28% for NASDAQ. Yet, most investors seem totally unaware of this substantial performance difference.
The UK’s sector exposures explain a lot of that outperformance. Chart 2 shows year-to-date performance of the MSCI ACWI excluding US Index. The worst performing sectors globally are the same as those in the US: Technology, Communications, and Consumer Discretionary.
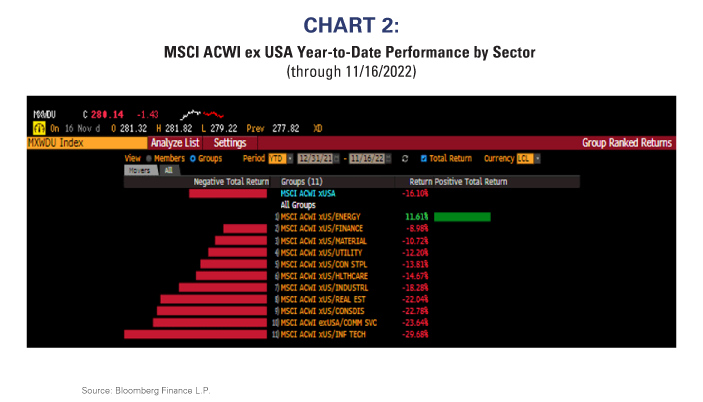
However, global equity markets do not have similar sector exposures, so countries with less exposure to poorly performing sectors and more exposure to better performing sectors are tending to outperform. The UK is a good example.
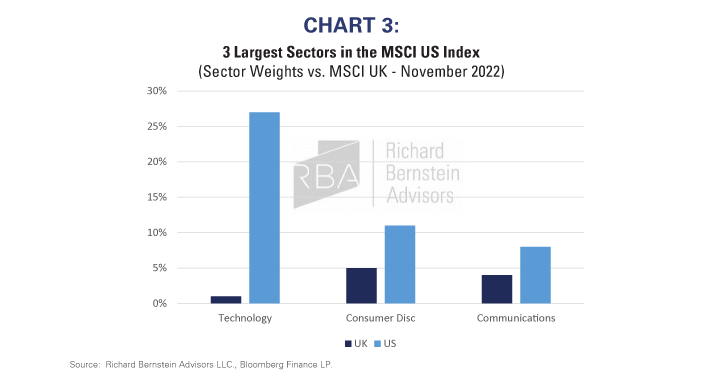
Chart 3 compares the weights of the three largest US sectors (Technology, Consumer Discretionary, and Communications) with those sectors’ weights within the MSCI UK Index. Whereas those three sectors still comprise about 48% of the US market despite the bear market, the sectors comprise only 10% of the UK market.
Reversing the analysis in Chart 4, the three largest sectors in the UK are Consumer Staples, Financials, and Energy. Those three sectors comprise over 50% of the UK stock market, but less than 25% of the US market.
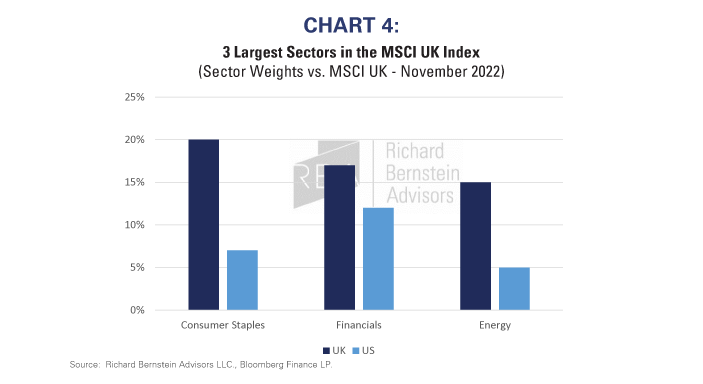
The UK’s outperformance versus the US has largely been a sector effect and not necessarily a country effect. When excluding the US, the three sectors dominating the UK market are among the world’s best performing sectors. Energy ranks 1st, Financials 2nd, and Consumer Staples 5th. While many investors were captivated by the UK’s dysfunctional political issues, the UK’s sector exposures provided significant outperformance relative to the US.
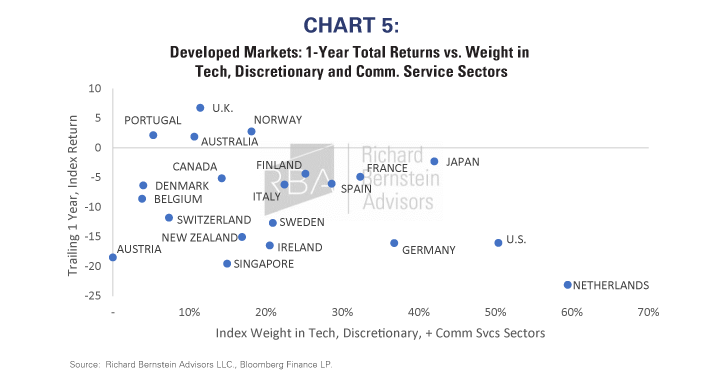
This has been true in virtually every global equity market. Chart 5 shows that year-to-date performance has been closely tied to sector exposure. Better performing countries so far this year have generally been those with the smallest exposure to Technology, Consumer Discretionary, and Communication Services stocks.
Investors’ concerns seem well discounted
We group valuation as a sentiment indicator simply because it is impossible to have a widely favored asset that is cheap or a widely hated asset that is expensive. Valuation, by definition, reflects investors’ sentiment.
There are many valid concerns about investing outside the US, but we think those risks seem to be already reflected in non-US valuations. Conversely, we also think there are risks within the US that investors seem to be ignoring.
To some extent we could re-write our 2014 report, but aim it toward non-US markets:
Is there anyone who is not aware of the risks to Taiwan?
Is there anyone who is not aware that the US dollar has hindered some non-US returns?
Is there anyone who is unaware of the Russia/Ukraine war and the risk to European energy supplies?
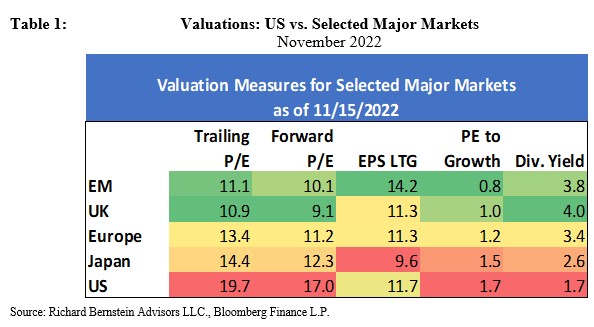
Table 1 shows a comparison of US valuations versus those of other major markets using several valuation measures. Non-US markets seem to offer sizable risk premia that seem attractive given the sector opportunities within non-US markets and the extreme hesitancy of US investors to invest abroad.
Global profit dynamics have significantly changed over the past 5 years. Charts 6 and 7 show normalized negative earnings surprises for major regions. We focus on negative earnings surprises because companies tend to manufacture positive surprises, i.e., they guide analysts to more pessimistic forecasts and then easily beat those lowered earnings figures. However, no company guides to a negative surprise, so negative surprises tend to contain more information about companies’ fundamentals than do positive surprises.
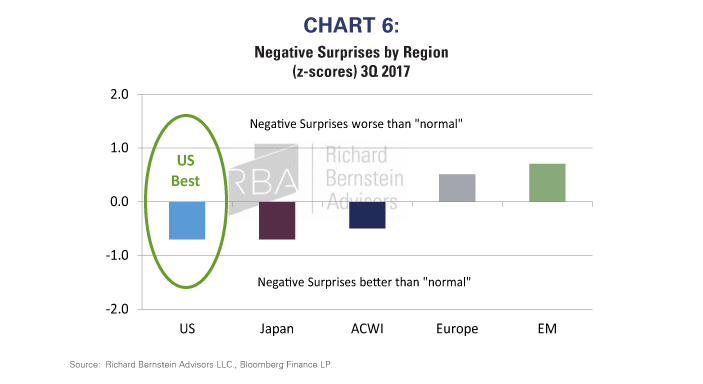
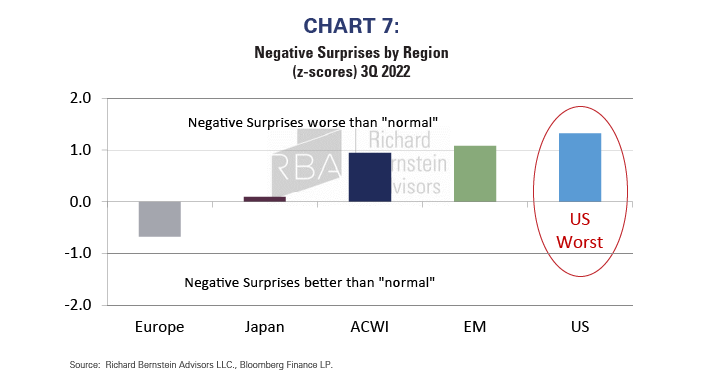
Five years ago, the US had the smallest normalized proportion of negative earnings surprises of any major region, but today the US has the highest proportion of negative surprises. This seems a significant warning signal because consensus remains quite bullish on the prospects for US equities relative to global equities.
The world is changing and so are our portfolios
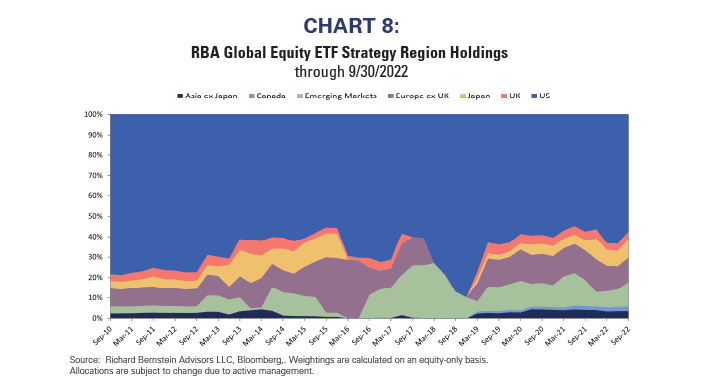
We describe our portfolios as chameleons, meaning they change their colors as the environment changes. Our increased exposure to non-US markets over the past several years is a relevant example. The US had significantly higher expected returns a decade ago and we were significantly overweight US stocks. Today, more regions have expected returns we see as being competitive to the US’s, and Chart 8 shows our allocations have shifted accordingly. Our non -US exposure was only 24% in September 2010, whereas today it is 37%, which represents a shift from less than ½ of benchmark weight in 2010 to roughly benchmark weight currently.
INDEX DESCRIPTIONS:
The following descriptions, while believed to be accurate, are in some cases abbreviated versions of more detailed or comprehensive definitions available from the sponsors or originators of the respective indices. Anyone interested in such further details is free to consult each such sponsor’s or originator’s website.
The past performance of an index is not a guarantee of future results.
Each index reflects an unmanaged universe of securities without any deduction for advisory fees or other expenses that would reduce actual returns, as well as the reinvestment of all income and dividends. An actual investment in the securities included in the index would require an investor to incur transaction costs, which would lower the performance results. Indices are not actively managed and investors cannot invest directly in the indices.
S&P 500®: S&P 500® Index: The S&P 500® Index is an unmanaged, capitalization-weighted index designed to measure the performance of the broad US economy through changes in the aggregate market value of 500 stocks representing all major industries.
Sector/Industries: Sector/industry references in this report are in accordance with the Global Industry Classification Standard (GICS®) developed by MSCI Barra and Standard & Poor’s.
Nasdaq: The NASDAQ Composite Index is a broad-based capitalization-weighted index of stocks in all three NASDAQ tiers: Global Select, Global Market and Capital Market. The index was developed with a base level of 100 as of February 5, 1971.
MSCI ACWI ex USA®: MSCI All Country World Index excluding USA. The MSCI ACWI® ex USA is a free-float-adjusted, market-capitalization-weighted index designed to measure the equity-market performance of global developed and emerging markets excluding the United States.
UK: MSCI UK Index. The MSCI United Kingdom (UK) Index is a free-float-adjusted, market-capitalization-weighted index designed to measure the equity-market performance of the United Kingdom.
