
As expected, April brought new lows in the data we monitor, and with it our first full view of the economic impact of the pandemic. In many cases, the data are historical and record breaking. However, several green shoots have begun to emerge, although it is much too early to call the beginning of the recovery with most households sequestered at home.
Unsurprisingly, the Astor Economic Index showed continued weakness in the U.S. economy, and remained at a level in line with contraction in domestic output. Aggregate estimates from economists surveyed by Bloomberg forecast the economy contracting 34% Q/Q SAAR in the second quarter of this year.

The most significant data release of the month was from the Bureau of Labor Statistics (BLS), which showed a net change in nonfarm payrolls of -20.2 million. It is difficult to contextualize the historic magnitude of this number. The previous record from 1945 was approximately 2 million (about 1.5% of the U.S. population) – scaled to population, April’s number is about 4 times larger.
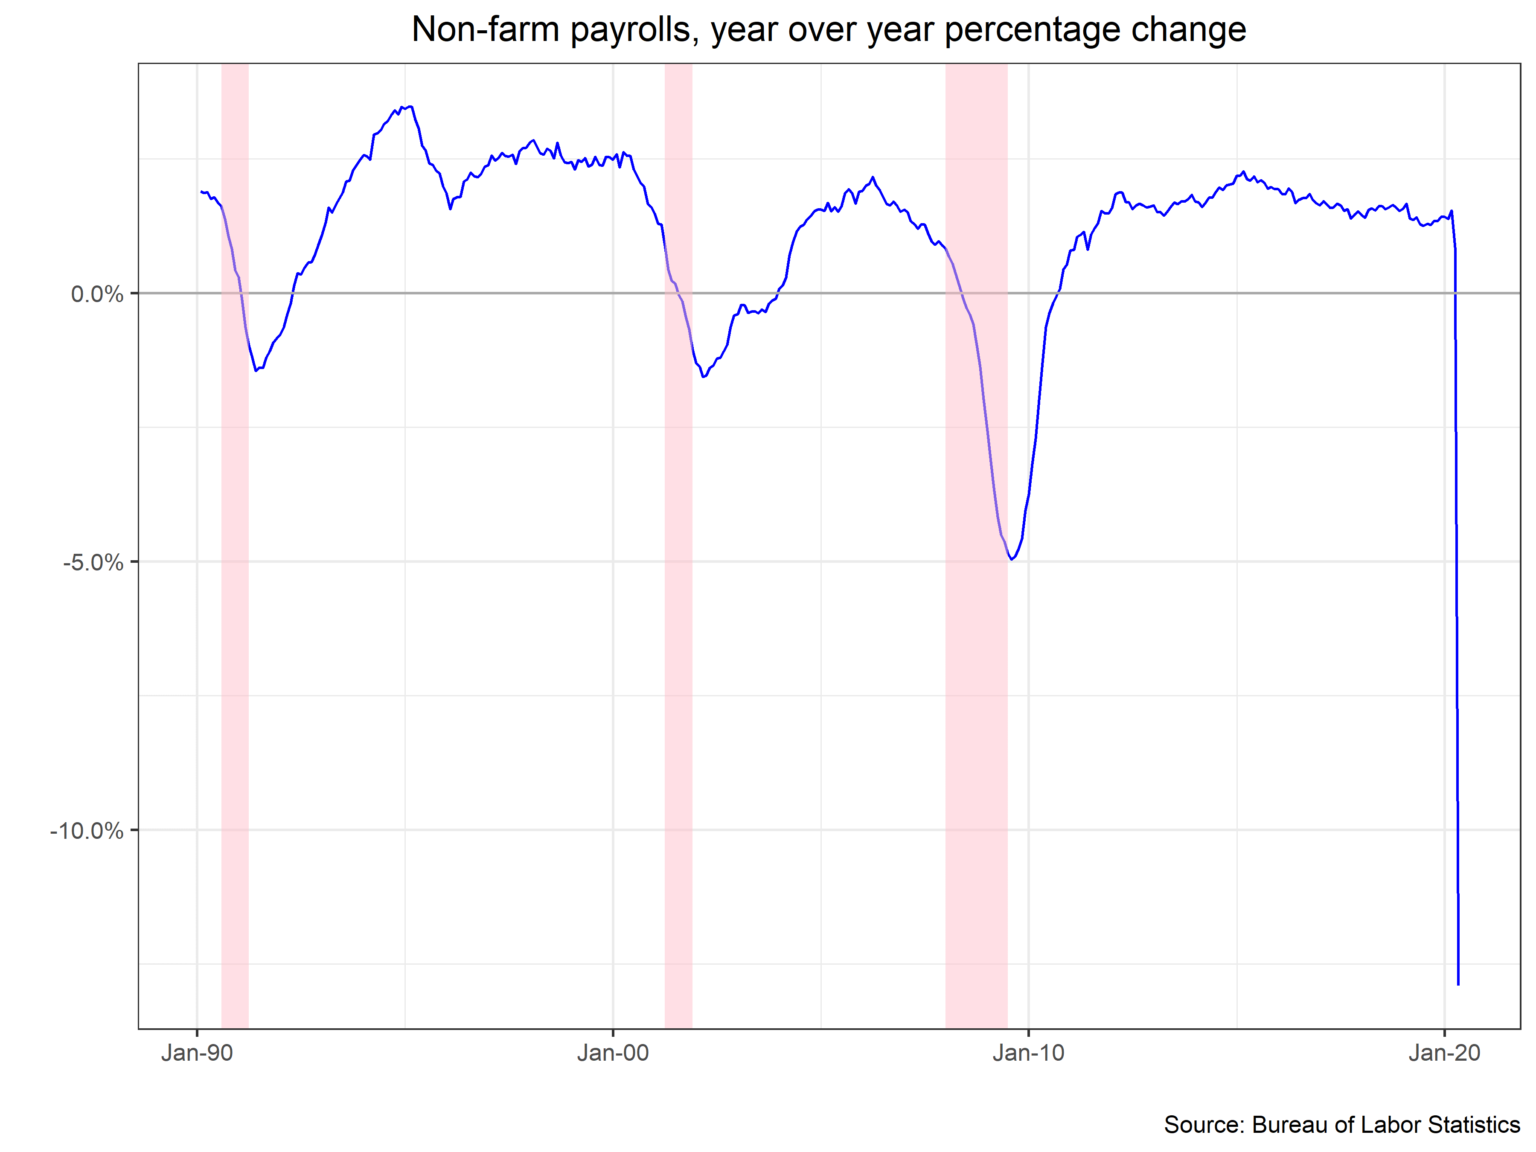
Measures of labor market slack skyrocketed accordingly. The unemployment rate (U3) rose to 14.7%, the highest since the Great Depression. Underemployment (U6) reflects those no longer looking for a job and rose to 22.8%, the highest on record. It is also possible that these numbers understate the situation by a large margin due to BLS model adjustments, Federal Pandemic Unemployment Assistance and misclassification of survey respondents; the BLS thinks U3 may be around 5 percentage points higher after adjusting for these considerations.

Jobless claims, our highest frequency picture of the employment situation, came further off the highs of March, with initial claims printings at about 2.998 million. Although this number would be shockingly large in any other context, the continued decline in initial claims suggests the starkest impact of closings may be behind us. Likewise, continuing claims, which captures those reapplying for unemployment insurance, was steady at 22.8 million. The share of the labor force using jobless benefits ticked up slightly to 15.7%. In aggregate, the data imply that the deepest cut to the labor market is behind us if reopening continues at a steady pace and the pandemic remains contained. Of course, the degree to which the labor market ultimately recovers is an open question.

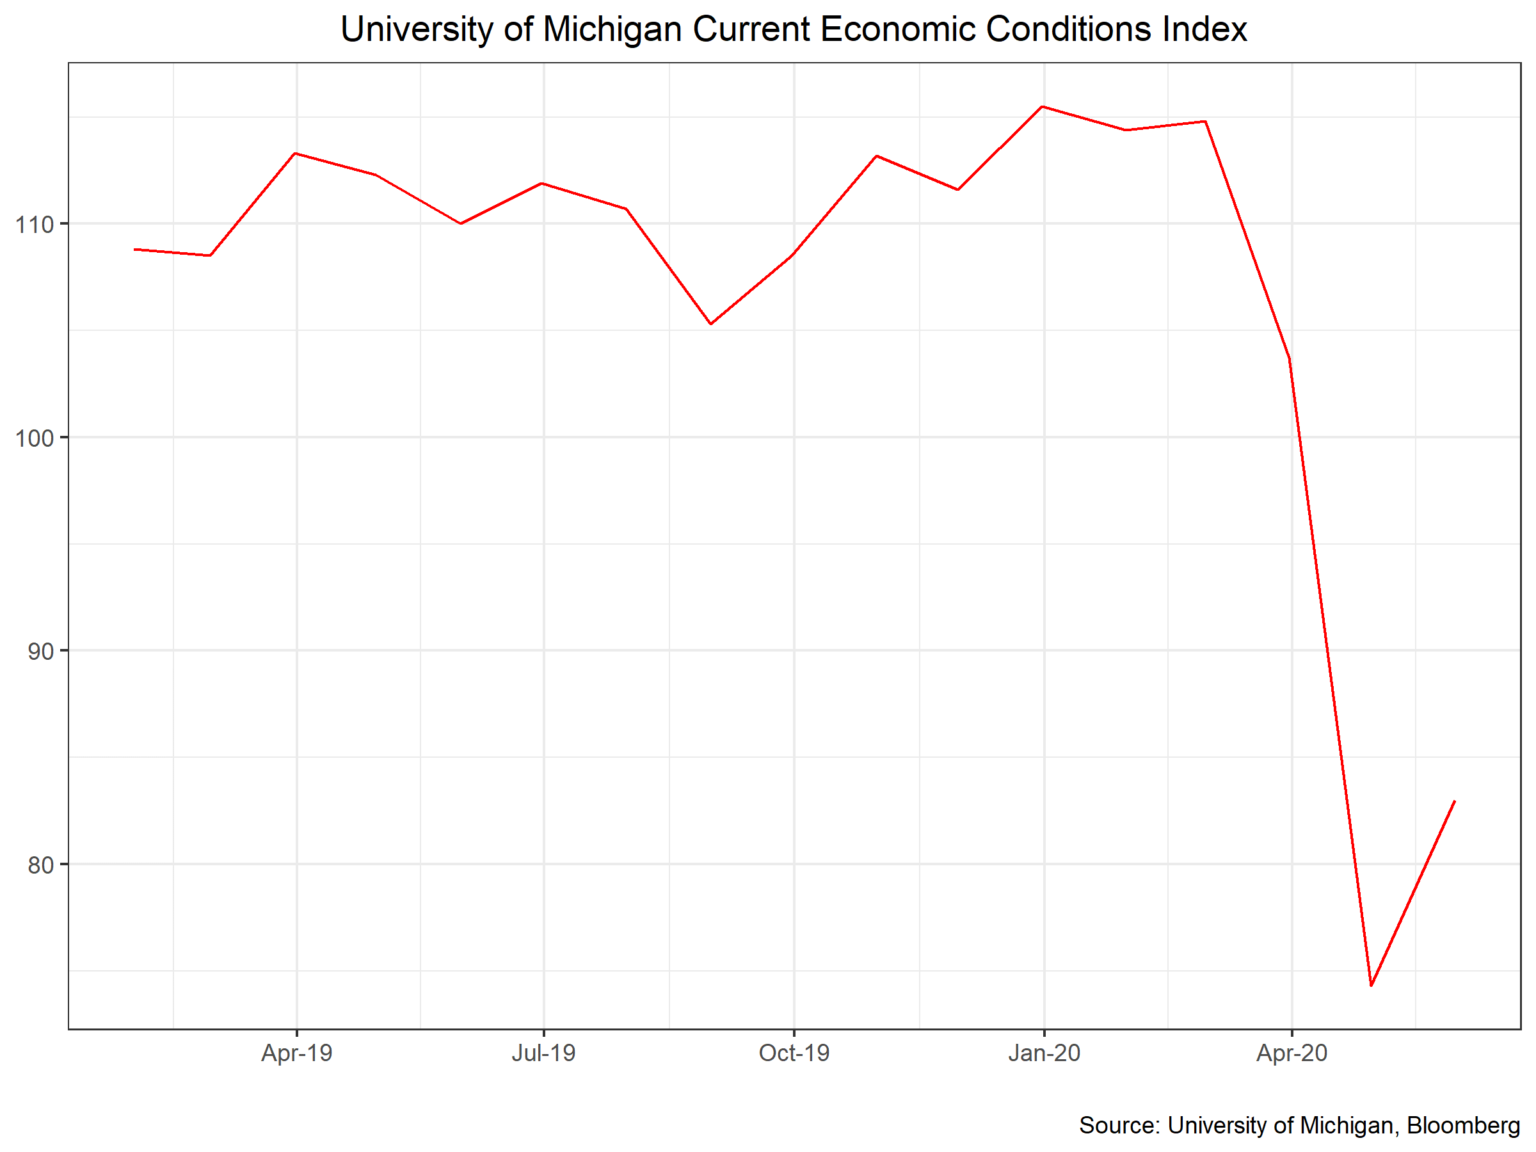
As some states move towards partially reopening businesses, it is worth looking at the data to see if we can detect any nascent signs of rebounding output. The University of Michigan’s consumer sentiment index ticked up slightly in May on the survey’s Current Condition’s component, largely driven by support from the government. Future Expectations continued to drag, however.
Open Table reservations have also begun to come off lows in states that have started to reopen, as the animation below depicts.
This recession is unlike others in that the causal shock in demand and supply is purely exogenous and hopefully transitory. The data above is worth watching closely over the coming months as restrictions on work and movement begin to ease. In particular, the ability of the labor force to regain lost ground quickly and resume consumption will be indicative of any lasting scars on the U.S. economy.
2020-246
U3: A common measure used to report the unemployment rate which is represented by the number of people actively looking for a job
U6 : A measurement of unemployment that also includes workers who would like to work but are not actively looking as well as individuals who, due to economic conditions, are working part-time but desire to be full-time
All information contained herein is for informational purposes only. This is not a solicitation to offer investment advice or services in any state where to do so would be unlawful. Analysis and research are provided for informational purposes only, not for trading or investing purposes. All opinions expressed are as of the date of publication and subject to change. Astor and its affiliates are not liable for the accuracy, usefulness or availability of any such information or liable for any trading or investing based on such information. There is no assurance that Astor’s investment programs will produce profitable returns or that any account with have similar results. You may lose money. Past results are no guarantee of future results.
The Astor Economic Index® is a proprietary index created by Astor Investment Management LLC. It represents an aggregation of various economic data points: including output and employment indicators. The Astor Economic Index® is designed to track the varying levels of growth within the U.S. economy by analyzing current trends against historical data. The Astor Economic Index® is not an investable product. When investing, there are multiple factors to consider. The Astor Economic Index® should not be used as the sole determining factor for your investment decisions. The Index is based on retroactive data points and may be subject to hindsight bias. There is no guarantee the Index will produce the same results in the future. The Astor Economic Index® is a tool created and used by Astor. All conclusions are those of Astor and are subject to change.
All information contained herein is for informational purposes only. This is not a solicitation to offer investment advice or services in any state where to do so would be unlawful. Analysis and research are provided for informational purposes only, not for trading or investing purposes. All opinions expressed are as of the date of publication and subject to change. Astor and its affiliates are not liable for the accuracy, usefulness or availability of any such information or liable for any trading or investing based on such information. Please refer to Astor’s Form ADV Part 2 for additional information regarding fees, risks and services.
