
In this edition of Investor Insights, our commentary will explore current investor sentiment, comment on market participation, and show the current ranking of market sectors. The Chart of the Week featured is the Energy sector.
Investor Sentiment
As we approach the Presidential election, it’s an opportune time to gauge investor sentiment. The American Association of Individual Investors (AAII) publishes a weekly Investor Sentiment Survey, categorizing respondents as bullish, neutral, or bearish to provide insight into retail investors’ collective mood. Importantly, AAII views market sentiment as a contrarian indicator, suggesting that markets often move counter to prevailing expectations.
The latest survey reveals that 46% of respondents are bullish on the markets, while 27% are bearish, with the remaining 27% neutral. Although bullish readings are on the higher end of historical averages, this represents a 5% decrease from the previous two weeks.
This week’s survey included a bonus question regarding the November elections’ impact on stock market expectations. Only 11% of respondents indicated increased optimism, while 52% reported greater caution, and 33% saw no impact.
In summary, while investors express caution heading into November, a high degree of market optimism persists. It’s worth noting that although sentiment is viewed as a contrarian indicator, and there is currently a high degree of optimism, it is good that investors are cautious. Remember, bull markets “crawl a wall of worry.” While the AAII Sentiment Survey offers valuable insights into market psychology, it should be considered alongside other indicators rather than in isolation when making investment decisions.
Market Participation and Sector Ranks
Global events currently appear to have little impact on the broad markets. The market’s Advance/Decline Line, which measures market breadth by comparing the number of advancing securities to declining ones, is at a high. This indicates that as market indexes rise, the proverbial rising tide is lifting most ships.
Of the eleven US sector ETFs (State Street Select Sector SPDRs), all eleven are in one of Canterbury’s technical bull Market States. Canterbury also ranks the sectors according to their Volatility-Weighted-Relative Strength (VWRS). VWRS is risk adjusted strength. The current sector rankings are displayed in the table below. Note that the S&P 500’s largest sector, Information Technology, is ranked second-to-last on a risk-adjusted basis. While in a bull Market State, the sector has been twice as volatile as the first ranked sector, Utilities.
| VWRS Rank | Sector |
| 1 | Utilities |
| 2 | Real Estate |
| 3 | Financials |
| 4 | Industrials |
| 5 | Communications |
| 6 | Staples |
| 7 | Discretionary |
| 8 | Health Care |
| 9 | Basic Materials |
| 10 | Information Technology |
| 11 | Energy |
Source: Canterbury Investment Management
Chart of the Week: Energy
This commentary’s Chart of the Week is interestingly the last ranked sector: Energy. The Energy sector is composed of stocks such as Exxon, Chevron, ConocoPhillips, and Schlumberger. The chart below shows the Energy sector ETF, XLE, along with some key points. Energy has gained some momentum in the news due to global events over the past week. From a technical perspective, it is beginning to break out of a technical channel and attempting to begin a new uptrend. See chart and points below.
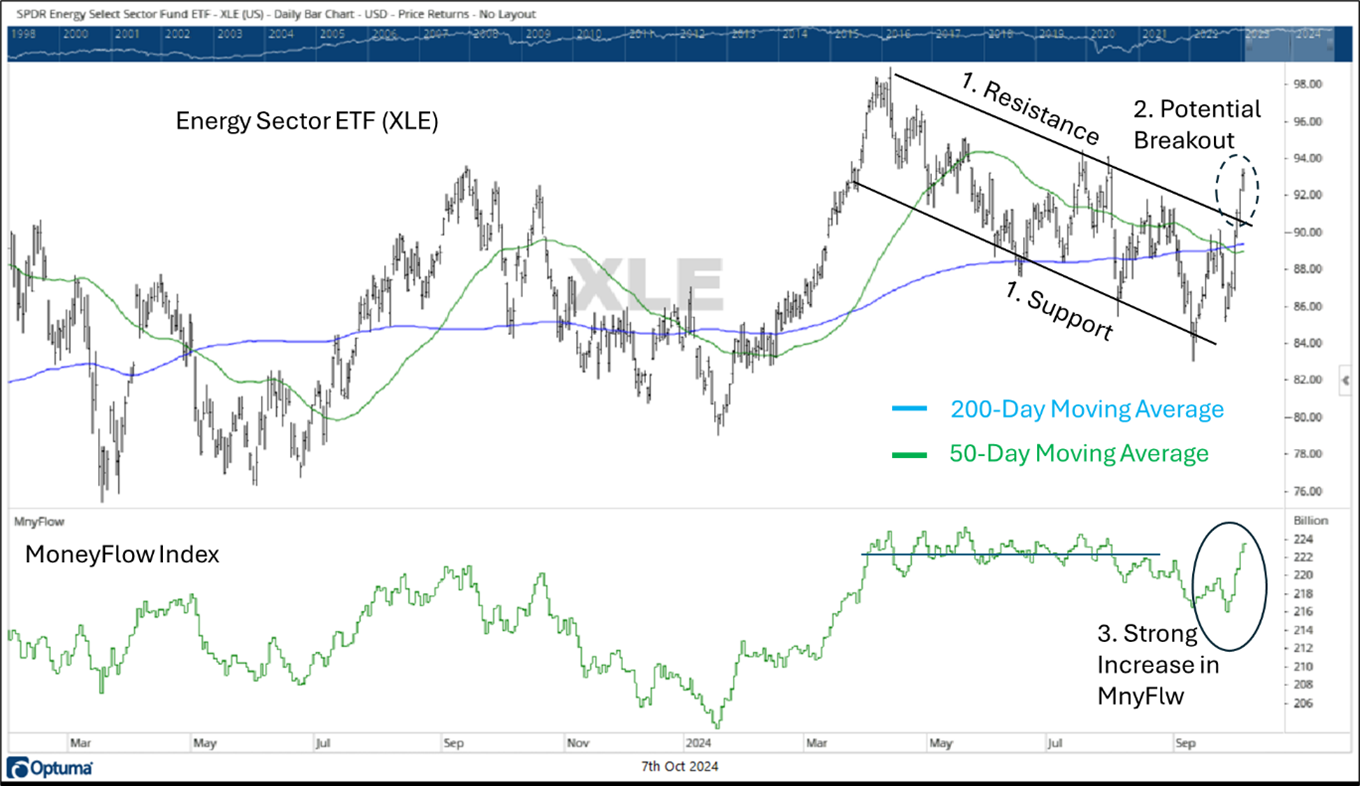
Source: Canterbury Investment Management. Chart created using Optuma Technical Analysis Software
- Downward Channel (March-Present):
- Energy has been in a downward trending “channel” (established a sloped series of lower highs and lower lows).
- 50-day and 200-day moving averages of price converged during this period.
- Recent Breakout:
- In the last week, Energy sector prices have risen, and broken out of the upper end of the channel (resistance)
- MoneyFlow:
- MoneyFlow: A “smart money” indicator based on volume and daily price movements
- Ideal scenario: Strong upward moves on rising MoneyFlow, declines on flat/increasing MoneyFlow
- Breakout occurred on strong, rising MoneyFlow
- Note: While Energy was in the downward sloping channel, MoneyFlow was flat (positive divergence)
This breakout, coupled with strong MoneyFlow, suggests a potential shift in the Energy sector’s trend. Canterbury continues to monitor for confirmation of a new uptrend.
Bottom Line
The general feeling right now is that investors are worried about the upcoming election and what impact it may or may not have on the markets. As shown by the sentiment survey, most investors are proceeding with caution, yet remain optimistic. Right now, markets are not reflecting any emotional environment. That could change but has not happened yet. Market participation has been strong, and rising tide is lifting most ships.
Keep in mind that if volatility does decide to rear its ugly head, Adaptive Portfolio Management is a comprehensive process designed to navigate market volatility. Instead of buying, holding, and rebalancing, an Adaptive portfolio will rotate and adjust to accommodate whichever market environment comes next- bull or bear.
For more news, information, and strategy, visit the ETF Strategist Channel.
