
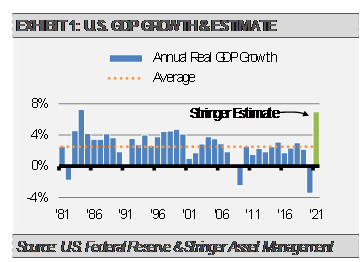
There are important distinctions between the real economy and the financial markets. We expect the course ahead to make those differences more obvious. Most of the economic indicators we track point to solid economic growth in the coming months along with significant supply constraints in everything from microchips to building materials to labor. These constraints will likely keep the pace of economic growth from reaching its full potential while also contributing to inflation. Still, we expect the strongest economic growth since 1984 with momentum carrying into 2022.
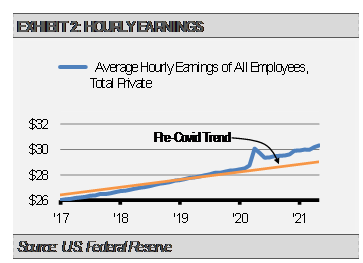
Our work also suggests that the inflationary tide is likely to be stronger and more persistent than markets and policy makers anticipate. The pace of economic growth accelerated further in May with the ISM Services Index rising to a new record high while the manufacturing sector also showed strong growth. Meanwhile, job openings in April soared to another new record at 9.3 million, which surpassed the previous record 8.2 million in March. Additionally, the employment report for May showed strong wage increases as employers struggle to fill job vacancies. This is especially telling because the fastest area of jobs creation was the leisure and hospitality industry where wages tend to be below the national average. Unlike other transitory inflationary pressures, such as rising oil prices, wages tend to be sticky, and these increases are likely to persist for some time.
We are likely to see faster gains in the monthly employment reports ahead as jobless claims, which is a proxy for layoffs, continue to decline. This is a positive sign for future jobs growth as trends in the number of layoffs tend to lead jobs creation. Lower numbers of jobless claims should result in higher numbers of jobs gains. There are a several fundamental factors that support more jobs growth ahead. With higher wages combined with enhanced unemployment benefits being phased out over the coming months, more people receiving the vaccines, schools reopening in the fall, and the continuation of broader economic reopening, we expect jobs gains to accelerate.
Despite strong fundamentals, at these current market valuations we expect modest equity market returns compared to above average economic growth.
Furthermore, we think bond markets will continue to struggle over the next year or so as long-term interest rates push higher. As the graph below illustrates, the level of earnings yield on equities and yield to worst on bonds relates to our forward return expectations. With the S&P 500 Index earnings yield relatively low at 3.36% and the Bloomberg Barclays Aggregate Bond Index yield to worst at 1.5%, which is at the low end of the historical range, our expectations for both stock and bond market returns going forward are rather modest. Meanwhile, our work suggests that markets may be overly complacent and vulnerable to a downside shock. These factors tilt our near-term bias to risk management over opportunity.

As a result, we are utilizing our active risk management tools and have reduced our equity risk while maintaining less interest rate sensitivity than the broad bond market. Additionally, we have increased our defensive postures as we anticipate greater market volatility and better opportunities for gains ahead.
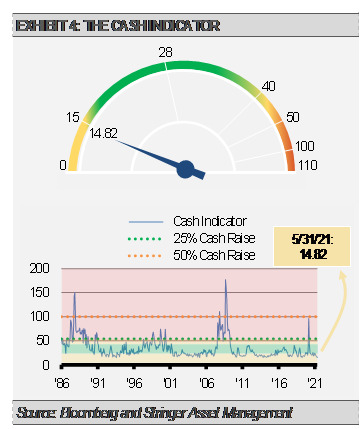
THE CASH INDICATOR
The Cash Indicator (CI) has been useful for helping us judge potential volatility on both the high and low end of the scale. Those who follow our process know that we are strong believers in the impact of mean-reversion. Just as the CI can alert us to black swans on the high end of the scale, it also provides insight into potential volatility on the low end of the range. Recently, the CI has fallen to a level that suggests markets are overly complacent. In our view, readings this low suggest that markets may be at risk of an unexpected shock. This is consistent with our recent moves to reduce equity market risk.
DISCLOSURES
Any forecasts, figures, opinions or investment techniques and strategies explained are Stringer Asset Management, LLC’s as of the date of publication. They are considered to be accurate at the time of writing, but no warranty of accuracy is given and no liability in respect to error or omission is accepted. They are subject to change without reference or notification. The views contained herein are not to be taken as advice or a recommendation to buy or sell any investment and the material should not be relied upon as containing sufficient information to support an investment decision. It should be noted that the value of investments and the income from them may fluctuate in accordance with market conditions and taxation agreements and investors may not get back the full amount invested.
Past performance and yield may not be a reliable guide to future performance. Current performance may be higher or lower than the performance quoted.
The securities identified and described may not represent all of the securities purchased, sold or recommended for client accounts. The reader should not assume that an investment in the securities identified was or will be profitable.
Data is provided by various sources and prepared by Stringer Asset Management, LLC and has not been verified or audited by an independent accountant.
Index Definitions:
Bloomberg Barclays U.S. Aggregate Bond Index – This Index provides a measure of the U.S. investment grade bond market, which includes investment grade U.S. Government bonds, investment grade corporate bonds, mortgage pass-through securities and asset-backed securities that are publicly offered for sale in the United States. The securities in the Index must have at least 1 year remaining to maturity. In addition, the securities must be denominated in US dollars and must be fixed rate, nonconvertible and taxable.
S&P 500 Index – This Index is a capitalization-weighted index of 500 stocks. The Index is designed to measure performance of a broad domestic economy through changes in the aggregate market value of 500 stocks representing all major industries.
