
By Doug Sandler, CFA, Head of Global Strategy
SUMMARY
- The Fed is starting to discuss interest rate hikes.
- This usually causes some uncertainty and volatility, in our view.
- We think stocks can tolerate rate hikes if done in response to strong growth.
We are Not Concerned by Rate Hikes in Response to Strong Growth
The release of the Federal Reserve’s December meeting minutes created a stir across financial markets last week. The minutes portrayed a Fed that is increasingly worried about inflation and likely to move away from their easy monetary policies more quickly than many had thought. Investors, who had been expecting a more measured approach, were clearly surprised by the news. Interest rates on the 10-year US Treasury Note rose from 1.68% to 1.76% and the S&P 500 was down 2.30% by the close on January 7th. Growth stocks fared worse with the NASDAQ Composite dropping 3.35% after the Fed minutes were communicated.
We are less concerned by the release and believe that a sell-off related to Fed tightening fears may represent an eventual buying opportunity. There are four reasons for our view:
- Risk of Policy Mistake Unlikely: Maintaining ‘price stability’ is the first goal within the Fed’s dual mandate and any spike in inflation (transitory or structural) will garner significant attention and discussion especially now that unemployment is down to 3.9%. In every rate hike cycle, the Fed’s challenge is to dampen growth enough to contain inflation while keeping the economy on a sustainable growth path. The analogy of a doctor gradually reducing pain medication for a recovering patient applies here… it needs to be fast enough to avoid dependency, but slow enough to not hinder recovery. Furthermore, the Fed is acutely aware of the time, cost, and effort required to nurse the economy back to health after the COVID-19-related shutdowns. We see it as unlikely that they will jeopardize their efforts by moving too quickly and will recalibrate their plan if the economy begins to struggle.
-
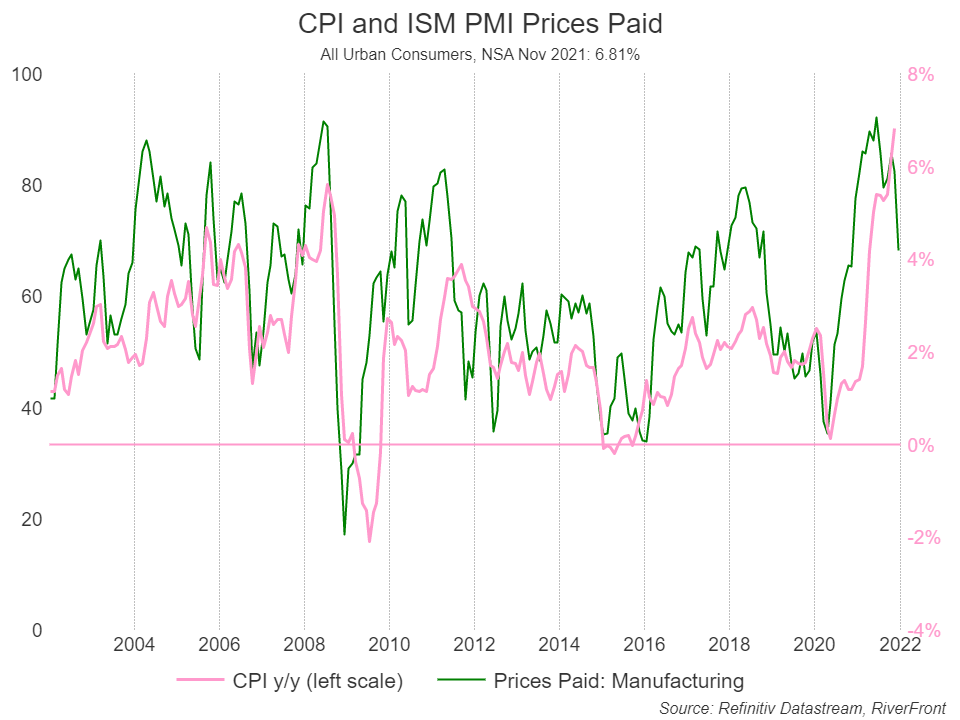
Chart shown for illustrative purposes only. See disclosures for definitions.
Inflation Might Be Peaking: If inflation stays high and the Fed’s hand is forced, they will have little choice but to remove accommodation more rapidly than planned. However, if inflation begins to fall, the current pressure on the Fed to act aggressively will be reduced. Fortunately, some recent data is beginning to suggest that inflation might be peaking or has already peaked. A reduction in job openings, a downturn in marine shipping rates, and a decline in the New York Fed’s Global Supply Chain Pressure barometer, are a few recent examples. Our favorite example is the reduction in the ISM-Manufacturing prices-paid index (green line in chart) because it has historically led declines in the Consumer Price Index (CPI-pink line in chart).
- Policy Remains Supportive: If the Fed raises interest rates three times in 2022 as the market expects, the Fed Funds rate still will not be above 1%. A modest shrinking of the balance sheet is also unlikely to be restrictive given that the Fed’s balance sheet doubled since the COVID-19 crisis began, and money supply (M3) has risen by over 30%. Given this, we would still characterize US monetary policy as supportive to both the economy and stocks.
- Removal of Accommodation is the Goal: While the end of excessively easy monetary policy may be coming more quickly than expected, this was always the Fed’s ultimate goal. After all, the role of policymakers throughout the economic shutdowns was to provide life support to the economy when it needed it. Now that the employment rate has recovered 96% of its COVID-19 decline, the Fed can begin to reduce its extraordinary accommodation, which we would view as an endorsement for the economy’s health. An increase in financial market volatility should be expected given the accelerated timeline, but we believe that things would look more dire if the opposite were true and the economy was not healthy enough to reduce accommodation.
Recent Portfolio Adjustments
Our investment team has been adjusting our positioning throughout the last 18 months to better prepare for a more volatile market environment and a potential shift in equity leadership. The adjustments to our balanced Advantage portfolios fall into the following categories.
- Rebalancing/Risk Reduction: Significant outperformance by stocks relative to bonds raises the risk profile of a balanced account if left unchecked. We have actively rebalanced the portfolios throughout 2021, and most recently in December, in response to the S&P 500’s 27% return. The end result is that, while our portfolios remain overweight stocks, we have reduced the risk.
- Underweight Fixed Income: Assuming inflation returns to a more normal level (3-4%) and interest rates remain relatively low, we expect stocks to soundly outperform bonds. A one-percent increase in 10-year interest rates would lead to a negative 9.22% return on the 10-year Treasury Note, well below the 6-8% return we anticipate for the S&P 500 in our base case scenario.
- Reduced Exposure to Growth Stocks and Increased Exposure to Value Stocks: Rising interest rates will impair some growth stocks more than value stocks, in our view. We believe that growth stocks with lower growth rates (defensive growth stocks) are most at risk and have reduced our exposure to them. In their place we have increased our exposure to more economically sensitive/value stocks, particularly in the industrial, material, energy, and financial sectors. In our longer-horizon portfolios, we favor select growth companies with strong and stable cash flows that should persist even as inflation and interest rates rise.
‘Process Over Prediction’ – What If We Are Wrong?
Our investment mantra is ‘Process over Prediction’. If we are too optimistic about Fed policy, we are ready to adjust our strategy accordingly. In our view, there are two potential policy mistakes the Fed could make: either moving too quickly (weakening the economy) or too slowly (allowing long-term inflation expectations to accelerate).
If Fed Moves Too Quickly and Growth Slows:
- Reduce Stock Risk: We would likely reduce equity risk in all of our balanced portfolios, but risk reduction would likely happen sooner in our shorter-horizon portfolios.
- Shift to Defensive Stocks: We would likely seek to lower our exposure to more cyclically sensitive stocks and shift to companies with more stable earnings that would be less affected by an economic slowdown.
If Fed Moves Too Slowly and Inflation Expectations Accelerate:
- Increase International Stocks: If inflation remains persistent and the global economy remains strong, we would likely add to our international stock markets due to their greater weighting in economically sensitive sectors.
- Further Shift to Favor Value Over Growth: Accelerating inflation expectations and thus more rate hikes favor value over growth for the reasons described in point 3 above. Thus far, our reduction in growth stocks and increase in value stocks has been measured and does not yet constitute a significant bet relative to our baseline benchmarks, and so we would likely move further in that direction.
Important Disclosure Information
The comments above refer generally to financial markets and not RiverFront portfolios or any related performance. Opinions expressed are current as of the date shown and are subject to change. Past performance is not indicative of future results and diversification does not ensure a profit or protect against loss. All investments carry some level of risk, including loss of principal. An investment cannot be made directly in an index.
Chartered Financial Analyst is a professional designation given by the CFA Institute (formerly AIMR) that measures the competence and integrity of financial analysts. Candidates are required to pass three levels of exams covering areas such as accounting, economics, ethics, money management and security analysis. Four years of investment/financial career experience are required before one can become a CFA charterholder. Enrollees in the program must hold a bachelor’s degree.
Information or data shown or used in this material was received from sources believed to be reliable, but accuracy is not guaranteed.
This report does not provide recipients with information or advice that is sufficient on which to base an investment decision. This report does not take into account the specific investment objectives, financial situation or need of any particular client and may not be suitable for all types of investors. Recipients should consider the contents of this report as a single factor in making an investment decision. Additional fundamental and other analyses would be required to make an investment decision about any individual security identified in this report.
Index Definitions:
Standard & Poor’s (S&P) 500 Index TR USD (Large Cap) measures the performance of 500 large cap stocks, which together represent about 80% of the total US equities market.
U.S Market Cap index information calculated based on data from CRSP 1925 US Indices Database ©2022 Center for Research in Security Prices (CRSP®), Booth School of Business, The University of Chicago. Used as a source for cap-based portfolio research appearing in publications, and by practitioners for benchmarking, the CRSP Cap-Based Portfolio Indices Product data tracks micro, small, mid- and large-cap stocks on monthly and quarterly frequencies. This product is used to track and analyze performance differentials between size-relative portfolios. CRSP ranks all NYSE companies by market capitalization and divides them into ten equally populated portfolios. Alternext and NASDAQ stocks are then placed into the deciles determined by the NYSE breakpoints, based on market capitalization. The series of 10 indices are identified as CRSP 1 through CRSP 10, where CRSP 10 has the largest population and smallest market-capitalization. CRSP portfolios 1-2 represent large cap stocks, portfolios 3-5 represent mid-caps and portfolios 6-10 represent small caps.
The Real Return is the annual percentage return realized on an investment adjusted for inflation. Trend, according to Price Matters® is the slope of an exponential growth function that closely tracks a real (inflation-adjusted) long term Index for that Asset Class. Distance from Trend is the distance of the trend line relative to the current index level expressed as a percentage.
Important Risk Considerations:
Stocks represent partial ownership of a corporation. If the corporation does well, its value increases, and investors share in the appreciation. However, if it goes bankrupt, or performs poorly, investors can lose their entire initial investment (i.e., the stock price can go to zero). Bonds represent a loan made by an investor to a corporation or government. As such, the investor gets a guaranteed interest rate for a specific period of time and expects to get their original investment back at the end of that time period, along with the interest earned. Investment risk is repayment of the principal (amount invested). In the event of a bankruptcy or other corporate disruption, bonds are senior to stocks. Investors should be aware of these differences prior to investing.
Technical analysis is based on the study of historical price movements and past trend patterns. There are no assurances that movements or trends can or will be duplicated in the future.
In a rising interest rate environment, the value of fixed-income securities generally declines.
When referring to being “overweight” or “underweight” relative to a market or asset class, RiverFront is referring to our current portfolios’ weightings compared to the composite benchmarks for each portfolio. Asset class weighting discussion refers to our Advantage portfolios. For more information on our other portfolios, please visit www.riverfrontig.com or contact your Financial Advisor.
RiverFront Investment Group, LLC (“RiverFront”), is a registered investment adviser with the Securities and Exchange Commission. Registration as an investment adviser does not imply any level of skill or expertise. Any discussion of specific securities is provided for informational purposes only and should not be deemed as investment advice or a recommendation to buy or sell any individual security mentioned. RiverFront is affiliated with Robert W. Baird & Co. Incorporated (“Baird”), member FINRA/SIPC, from its minority ownership interest in RiverFront. RiverFront is owned primarily by its employees through RiverFront Investment Holding Group, LLC, the holding company for RiverFront. Baird Financial Corporation (BFC) is a minority owner of RiverFront Investment Holding Group, LLC and therefore an indirect owner of RiverFront. BFC is the parent company of Robert W. Baird & Co. Incorporated, a registered broker/dealer and investment adviser.
To review other risks and more information about RiverFront, please visit the website at www.riverfrontig.com and the Form ADV, Part 2A. Copyright ©2022 RiverFront Investment Group. All Rights Reserved. ID 1980790
