
By Doug Sandler, CFA, Head of Global Strategy
SUMMARY
- Inflation concerns are driving markets and we are watching five data points for signs of improvement.
- While a recession is likely, we believe it will be mild due to consumer and business financial stability.
- Thus far, the secular bull market that began in 2009 remains intact and may proceed in a similar fashion to the 1956 -1966 period.
We are proud to release our July 2022 Chart Pack – our visual quarterly designed to walk investors through our views on what’s happening and why, predictions about what may come next, and positioning in our RiverFront portfolios. In today’s Weekly View, we created a concise synopsis of three selected visuals from the Chart Pack that encapsulate a few key takeaways.
Inflation and The Fed’s Response Took Center Stage; Markets Now Fear Inflation and Recession
The first quarter of 2022 was challenging for investors, and the second quarter was no different. At RiverFront, we believe maintaining a focus on long-term plans is critical in these market environments – investors that step out of the market or deviate too far from their long-term plans could lose money. We believe that our ability to make tactical shifts in positioning will be valuable as the market generally over-reacts as it processes rate increases and Federal Reserve (Fed) actions.

Source: Refinitiv Datastream, RiverFront; data monthly, as of May 2022. Shown for illustrative purposes only. The NY Fed Global Supply Chain Pressure Index (GSCPI) integrates a number of commonly used metrics with the aim of providing a comprehensive summary of potential supply chain disruptions. The Consumer Price Index (CPI) is a measure of the average change over time in the prices paid by urban consumers for a market basket of consumer goods and services.
Inflation: Signs of Clouds Clearing… What We Need to See
- An easing of supply chain pressures: The NY Fed produces a barometer of supply chain pressure that tends to lead CPI by roughly 3 to 4 quarters (see chart, left). This index has fallen from its year-end high but remains elevated.
- Lower bond yields: The bond market has reflected investors’ fears of higher inflation. We are watching for signs that investors become more concerned with the slowdown in economic growth.
- Commodity prices must stop rising: Oil has weakened slightly to around $95/barrel; industrial metals and lumber prices have fallen recently.
- Signs of the labor market easing: We are watching higher weekly claims for initial unemployment, as well as wage surveys and other labor data.
Increased Chinese export volumes: As Shanghai reopens from its recent COVID-19 lockdown, China’s exports are increasing, which is an encouraging sign in our view.
Recession Watch: US Consumers & Businesses in Stable Financial Shape, in Our View
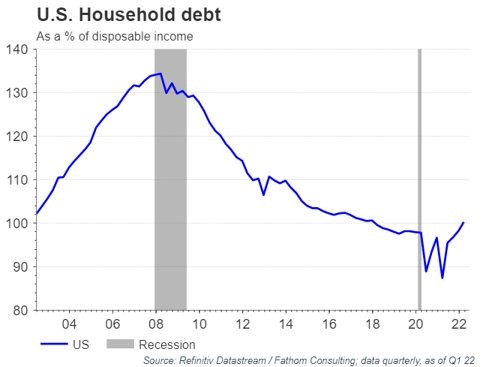
Gross domestic product (GDP) is a monetary measure of the market value of all final goods and services produced in a period (quarterly or yearly) of time. Chart Source: Refinitiv Datastream, Fathom Consulting; data quarterly as of Q1 2022. Shown for illustrative purposes only. *Source: The Economist; What America’s next recession will look like; 06.01.2022, Updated 06.14.2022.
The jury is still out whether the US can stay out of recession this year. However, in the event we enter a downturn, we think the US consumer and corporations are in better shape than in previous recessions:
- Consumer debt low: US consumer debt as a percentage of income is significantly lower than right before the 2008 housing crisis (see chart, left).
- Consumer savings high: Consumers also have roughly $2T in excess savings versus pre-COVID-19 times, or ~9% of GDP, according to a recent Economist article*.
- Companies financially sound: Some companies advantageously refinanced debt at lower rates and for longer durations over the last few years, likely lowering default rates in a recession, in our view. The Economist estimates that in 2021, companies reduced debt due this year by 27%, or $250B.
- Banking system less risky: We think the banking system has a lower risk of insolvency than during 2008 crisis; capital adequacy ratios for US banks – a measure of financial stability – are 60% greater than in 2007.
What Was Old May Be New Again; Offering Clues about the Secular Bull Market’s Next Stages
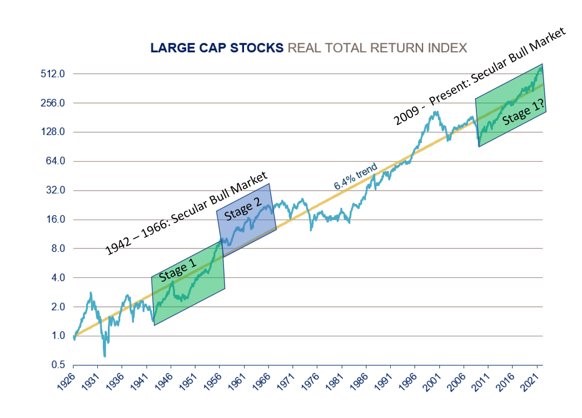
Source: RiverFront Investment Group, calculated based on data from CRSP 1925 US Indices Database ©2022 Center for Research in Security Prices (CRSP®), Booth School of Business, The University of Chicago. Data from January 1926 through May 2022. Trend, according to Price Matters®, is the slope of an exponential growth function that closely tracks a real (inflation- adjusted) long term Index for that Asset Class. Real Return is the annual percentage return realized on an investment adjusted for inflation. The chart, left, uses a logarithmic scale. Line movements will be dampened/subdued based on the exponential y-axis. Past results are no guarantee of future results, and no representation is made that a client will or is likely to achieve positive returns, avoid losses, or experience returns similar to those shown or experienced in the past. It is not possible to invest directly in an index. Shown for illustrative purposes only and not indicative of RiverFront portfolio performance. A secular market is a market that is driven by forces that could be in place for many years, causing the price of a particular investment or asset class to rise or fall over a long period. In a secular bull market, positive conditions such as low interest rates and strong corporate earnings push stock prices higher
Given that history rarely repeats itself exactly, it does often rhyme, and we believe it makes sense to review prior secular bull markets to look for patterns that feel familiar. In our view, the most similar may be the secular bull market, which occurred between 1942 and 1966, particularly the second stage (1956-1966).
- Periods of innovation and progress: Innovation drives consumer desire and business investment.
- Demographic tailwinds: Then: The birth of the ‘Baby Boomers’. Now: Millennials in prime spending years.
- Stocks not cheap and rates rising: US large-cap stocks valued above trend according to RiverFront’s Price Matters
- Prevalence of macro challenges and conflict: Economic periods of inflation and two recessions, social, and geo-political conflict all contributed to heightened volatility.
Important Disclosure Information:
The comments above refer generally to financial markets and not RiverFront portfolios or any related performance. Opinions expressed are current as of the date shown and are subject to change. Past performance is not indicative of future results and diversification does not ensure a profit or protect against loss. All investments carry some level of risk, including loss of principal. An investment cannot be made directly in an index.
Chartered Financial Analyst is a professional designation given by the CFA Institute (formerly AIMR) that measures the competence and integrity of financial analysts. Candidates are required to pass three levels of exams covering areas such as accounting, economics, ethics, money management and security analysis. Four years of investment/financial career experience are required before one can become a CFA charterholder. Enrollees in the program must hold a bachelor’s degree.
Information or data shown or used in this material was received from sources believed to be reliable, but accuracy is not guaranteed.
All charts shown for illustrative purposes only. Information or data shown or used in this material was received from sources believed to be reliable, but accuracy is not guaranteed.
This report does not provide recipients with information or advice that is sufficient on which to base an investment decision. This report does not take into account the specific investment objectives, financial situation or need of any particular client and may not be suitable for all types of investors. Recipients should consider the contents of this report as a single factor in making an investment decision. Additional fundamental and other analyses would be required to make an investment decision about any individual security identified in this report.
The Consumer Price Index (CPI) is a measure that examines the weighted average of prices of a basket of consumer goods and services, such as transportation, food, and medical care. It is calculated by taking price changes for each item in the predetermined basket of goods and averaging them. Changes in the CPI are used to assess price changes associated with the cost of living. The CPI is one of the most frequently used statistics for identifying periods of inflation or deflation.
The producer price index (PPI), published by the Bureau of Labor Statistics (BLS), is a group of indexes that calculates and represents the average movement in selling prices from domestic production over time. It is a measure of inflation based on input costs to producers.
Gross domestic product (GDP) is a monetary measure of the market value of all final goods and services produced in a period (quarterly or yearly) of time.
The NY Fed Global Supply Chain Pressure Index (GSCPI) integrates a number of commonly used metrics with the aim of providing a comprehensive summary of potential supply chain disruptions.
Stocks represent partial ownership of a corporation. If the corporation does well, its value increases, and investors share in the appreciation. However, if it goes bankrupt, or performs poorly, investors can lose their entire initial investment (i.e., the stock price can go to zero).
Bonds represent a loan made by an investor to a corporation or government. As such, the investor gets a guaranteed interest rate for a specific period of time and expects to get their original investment back at the end of that time period, along with the interest earned. Investment risk is repayment of the principal (amount invested). In the event of a bankruptcy or other corporate disruption, bonds are senior to stocks. Investors should be aware of these differences prior to investing.
RiverFront’s Price Matters® discipline compares inflation-adjusted current prices relative to their long-term trend to help identify extremes in valuation.
Investments in international and emerging markets securities include exposure to risks such as currency fluctuations, foreign taxes and regulations, and the potential for illiquid markets and political instability.
Center for Research in Security Prices (CRSP®) Market Cap index information calculated based on data from CRSP 1925 US Indices Database ©2022 Center for Research in Security Prices (CRSP®), Booth School of Business, The University of Chicago. Used as a source for cap- based portfolio research appearing in publications, and by practitioners for benchmarking, the CRSP Cap-Based Portfolio Indices product data tracks micro, small, mid- and large-cap stocks on monthly and quarterly frequencies. This product is used to track and analyze performance differentials between size-relative portfolios. CRSP ranks all NYSE companies by market capitalization and divides them into 10 equally populated portfolios. Alternext and NASDAQ stocks are then placed into the deciles determined by the NYSE breakpoints, based on market capitalization. The series of 10 indices is identified as CRSP 1 through CRSP 10, where CRSP 10 has the largest population and smallest market capitalization. CRSP portfolios 1-2 represent large cap stocks, portfolios 3-5 represent mid- caps and portfolios 6-10 represent small caps.
RiverFront Investment Group, LLC (“RiverFront”), is a registered investment adviser with the Securities and Exchange Commission. Registration as an investment adviser does not imply any level of skill or expertise. Any discussion of specific securities is provided for informational purposes only and should not be deemed as investment advice or a recommendation to buy or sell any individual security mentioned. RiverFront is affiliated with Robert W. Baird & Co. Incorporated (“Baird”), member FINRA/SIPC, from its minority ownership interest in RiverFront. RiverFront is owned primarily by its employees through RiverFront Investment Holding Group, LLC, the holding company for RiverFront. Baird Financial Corporation (BFC) is a minority owner of RiverFront Investment Holding Group, LLC and therefore an indirect owner of RiverFront. BFC is the parent company of Robert W. Baird & Co. Incorporated, a registered broker/dealer and investment adviser.
To review other risks and more information about RiverFront, please visit the website at www.riverfrontig.com and the Form ADV, Part 2A. Copyright ©2022 RiverFront Investment Group. All Rights Reserved. ID 2310388
