
In the midst of what appears to be a unique Q2 earnings season, with strong results and unimpressive guidance (especially for the technology sector), along with increased fears surrounding the Delta Covid variant, we are further reminded of the differences between the markets and the economy. Rewind to the start of 2020: most were worried the market was approaching the later stages of a growth cycle. The S&P 500 is up 39.6% in 19 months since the beginning of 2020. Covid aside, we have immense stimulus added to the economic system; 40% of all dollars in circulation were printed since Covid. Maybe the 40% S&P 500 run makes sense? Innovation curve adoptions and advancements in how and where life and work, that will not fully retrace in an opened, closed, or transitory economy, should be conducted. It is quite possible our economy is most efficient with all of us sitting at home using disposable income on investments and goods instead of services, ironically. The long-lasting productivity gains that will continue to exist in a future, fully reopened world are a front and center question that will determine if we are in the midst of a new growth cycle, or on fumes building in the economy pre-Covid. Ironically, our answer is both. In our last commentary, we wrote that the S&P 500 could end the year anywhere between up 30% and down 70%. Unfortunately, the potential outcomes, given all of the variables, are just as wide. Innovation in many fields is real, and will continue on a rampant pace. Independently of that, there will be numerous economic shocks along the way, with the first potentially around the corner, given the never-ending rewritten US debt ceiling talks.
As a society we are grappling at the benefits between maximum economic efficiency and the happiness of its participants. We are left with more questions than answers on who and what benefits from all of this quantitative easing, and for how long those effects may last. What if extended recessions actually benefit the poor? What if extended recessions are needed in order to shake out the over-leveraged 1% and allow for redistribution of wealth based on competition? The 2020 recession officially lasted two months, ending April 2020. We had a 128- month fed induced expansion, followed by a 2-month recession. That was it. Risk takers of all sorts and in basically any asset were rewarded.
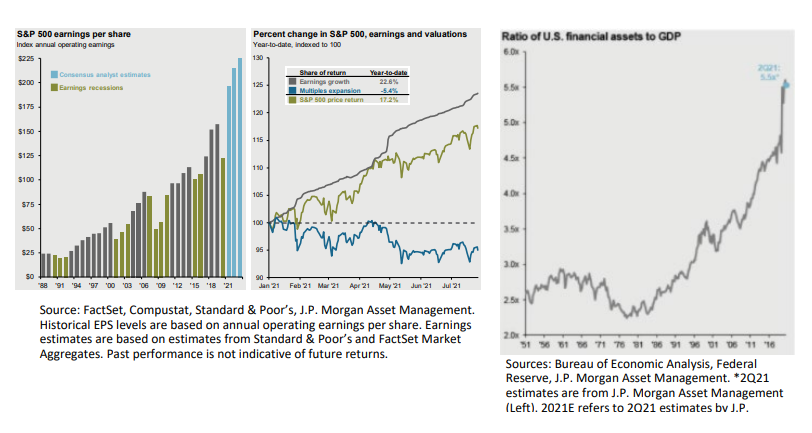
Earnings have come roaring back, and most of the returns in markets have actually come from earnings growth over multiple expansions in 2021. S&P 500 earnings estimates for the second half of 2021 are expected to hit all-time highs, far beyond where we were pre-Covid. The chart above on the right shows the ratio of US financial assets to GDP. GDP is roaring back, earnings are higher than ever, and assets are as expensive compared to actual GDP as they ever have been. There is potential for a very strong US stock market in 2021, mainly due to the massive amount of stimulus and relatively strong vaccine rollout. There are many risks that could throw a wrench in this. Regardless, another strong second half in equity markets is a potential outcome for the rest of 2021.
One of the most discussed fears is inflation. The irony is, just as most hot investment topics, it is almost impossible to actually calculate what inflation is. Everyone actually does have a unique inflation profile based on their own current lifestyle. Much like the K-shaped recovery, a Kshaped or otherwise skewed inflation could affect just the rich, just the poor, or ultimately end up transitory, potentially stagflationary for some, or even deflationary for others. The consumer price index has been adjusted more times than we can count. It has chicken as a substitute for many other things, and no inclusion of an iPhone. Companies are most certainly feeling price pressure on inputs in goods, supply chains, and even services, as the economy rebounds. This could be the first stage of inflation, or actually just transitory, or could even lead to an inventory build-up next summer and add deflationary fears into the mix.
Some believe the fed will not admit actual inflation until it is too late, as they are not well equipped to fight it in any form, with the debt at levels seen today. Any longer-standing inflation would inevitably hinder the profit margin rebound we’re experiencing, even as producers try and pass along increased costs to consumers, which would require wage growth to avoid a stagflation environment. Transitory inflation, or even deflation (only possible from continued innovation growth), are the best outcomes of the bunch, and we anticipate transitory inflation is most likely. However, we included the entirety of the list to portray how random and unpredictable the next 12 months could be. Things actually look great in the economy on a macro basis, and we are likely about to continue to climb an insane wall of worry for the next few months. If savings rates drop too far and inflation fears don’t calm, our outlook could change.
Geopolitical Fears
The fight for secure information and fear of big tech is here. The US has restricted Chinese tech companies in the US, and China has in turn put into question the viability of any listed US tech company. Think of it as a case of prisoner’s dilemma, except the list of players and would-be collusions includes democrats, republicans, the Chinese national party, the US tech giants, and the Chinese tech giants, just to name a few. While we battle each other economically, we are also internally both uneasy with the level of total economic domination those tech companies have within each economy. We still very much prefer the Chinese tech giants over the US FAANG names, but there is potential for concern in both.
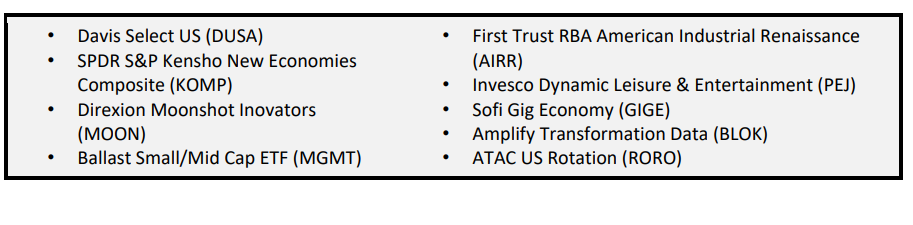
US Equities
The iShares S&P 500 ETF (IVV) finished the first half of the year up 15.23%, up 17.95% through the end of July. It was truly a tale of two halves this year, as the first quarter saw huge rallies in small caps and value stocks, while growth stocks prevailed in the second quarter. By the end of July, the iShares S&P 500 Growth ETF (IVW) is now ahead of the iShares S&P 500 Value ETF (IVE), 18.51% vs 17.08% respectively. The reversal has correlated with treasuries, as value outperformed and yields were rising. Despite escalated fears in inflation, treasury yields have fallen and growth stocks have once again prevailed. Small caps continue on their strong pace, up 26.85% for the year adding 3.42% in July. On an economic front, GDP slightly disappointed in Q2, up 6.5% vs an anticipated 8.5%. The pace of consumption could slow, but still remain strong heading into Q3 with a less elevated savings rate of 9.4%. In our last commentary, we mentioned growth had room to run, and we anticipate it to continue, albeit non-traditional non FAANG growth names that have to be sourced uniquely. We are wary of all market cap indexes at this point. Much of the Russell 2000 continues to exist without profits.
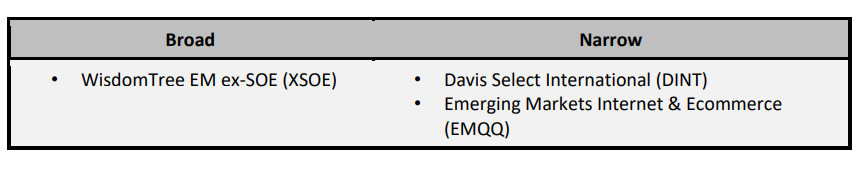
International Developed & Emerging Markets
MSCI ACWI ex US, measured by the iShares MSCI ACWI ex US ETF (ACWX), was up 7.23% through July. iShares MSCI EAFE ETF (EFA) was up 9.86%, while the iShares MSCI EM ETF (EEM) erased all of its first quarter gains and is down -0.26% for the year. International developed equities are the value play of all value plays, or a perpetual value trap lead by an unhealthy banking system hooked on the ECB. They continue to be further behind the US in its vaccination rollout. The story in emerging markets is China. The fear of information between the US and China has continued to hurt the largest tech players in both markets, and recent actions out of China put into question the likelihood of further Chinese tech giants listing in US markets. Internally, China is going as far as to try and make education tech companies exist without profits. It is important to note that many of the largest state-owned enterprises have similar mandates and continue to produce profits, but this is all troubling in the short term. Whether capital continues to flow towards the Chinese tech space or not, regardless of where these companies are listed, will likely guide their short-term fate, but longer term, we still see potential in this space.
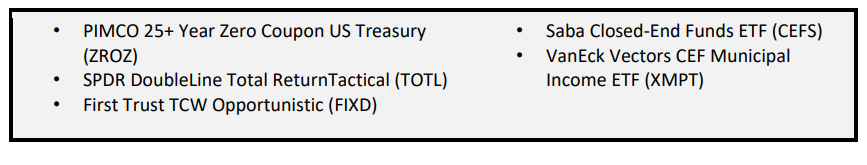
Fixed Income
iShares Core US Aggregate Bond ETF (AGG) bounced back in the second quarter and July, and is now only down 0.54% for the year. Similar, but unrelated to the debt levels, the duration of AGG continues to climb as well, meaning increases in interest rates in the future will have more downside than in the past for each movement in yield. Long-term treasuries measured by the iShares 20+ Year Treasury Bond ETF (TLT) are still down -4.6% on the year, but climbed 6.95% in Q1 and 3.69 in July. We wouldn’t get too aggressive on the lower credit side of the spectrum here, given how tight credit spreads are. Active is preferred here as well. Broad indexes are highly weighted in debt, rated just above default, which will be a problem if the Fed-induced merry-go-round even shows slight signs of stalling.

Alternatives
Invesco DB Commodity Index Tracking ETF (DBC) is up 33.28% YTD, but has slowed down as of late, up only 1.57% in July. Gold rebounded from a terrible first quarter, quietly up 7.8% since then, but still down -3.68% on the year. It’s been a tough year for alternatives, but if you diligently rebalanced your longer-term treasuries with gold, bitcoin, and inflation protection, you have performed well in this bucket.
A hypothetical high-active-share reconstruction of a traditional 60/40:
• 5% PIMCO 25+ Year Zero Coupon US Treasury Index ETF (ZROZ)
• 7.5% Saba Closed-End Funds ETF (CEFS)
• 5% AGFiQ US Market Neutral Anti-Beta (BTAL)
• 5% Quadratic Interest Rate Volatility Infl (IVOL)
• 10 % SPDR Gold MiniShares Trust (GLDM)
• 7.5% Amplify Transformational Data Sharing ETF (BLOK)
• 7.5% Sofi Gig Economy ETF (GIGE)
• 7.5% SPDR S&P Kensho New Economies Comps (KOMP)
• 7.5% Davis Select Worldwide ETF (DWLD)
• 7.5% Emerging Markets Internet & Ecommerce (EMQQ)
• 7.5% Ballast Small / Mid Cap ETF (MGMT)
• 7.5% Direxion Moonshot Innovators ETF (MOON)
• 5% First Trust Industrial Renaissance (AIRR)
• 5% Invesco Dynamic Leisure & Entertainment ETF (MOON)
• 5% Distillate US Fundamental Stability & Value ETF (DSTL)
Conclusion
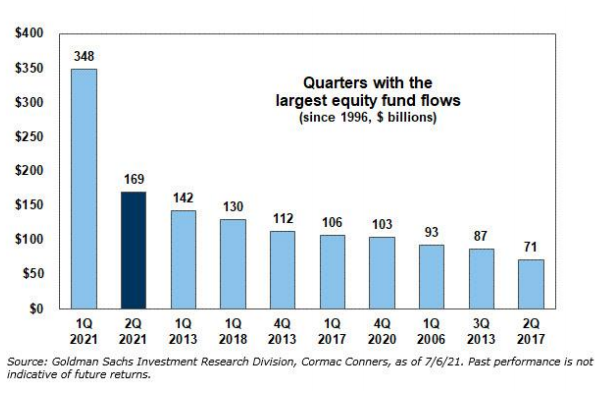
One thing to keep an eye on is equity flows. While flows over this 13-year market run have been rather unimpressive, the same cannot be said for this year. Equity funds have seen over $500 billion in inflows in 2021. Q1 and Q2 2021 were the two largest quarterly equity flows, going all the way back to 1996. Q4 2020 is also on the top 10 list. Q1 2021 had a record inflow of $348 billion dollars, 245% the previous record in Q1 2013 (until Q2 2021 took second place with $169 billion). We would not anticipate another record quarter of flows in Q3.
Originally published by Toroso
Disclosure
The information provided here is for financial professionals only and should not be considered an individualized recommendation or personalized investment advice. The investment strategies mentioned here may not be suitable for everyone. Each investor needs to review an investment strategy for his or her own particular situation before making any investment decision.
All expressions of opinion are subject to change without notice in reaction to shifting market conditions. Data contained herein from third party providers is obtained from what are considered reliable sources. However, its accuracy, completeness or reliability cannot be guaranteed.
Examples provided are for illustrative purposes only and not intended to be reflective of results you can expect to achieve.
All investments involve risk, including possible loss of principal.
The value of investments and the income from them can go down as well as up and investors may not get back the amounts originally invested, and can be affected by changes in interest rates, in exchange rates, general market conditions, political, social and economic developments and other variable factors. Investment involves risks including but not limited to, possible delays in payments and loss of income or capital. Neither Toroso nor any of its affiliates guarantees any rate of return or the return of capital invested. This commentary material is available for informational purposes only and nothing herein constitutes an offer to sell or a solicitation of an offer to buy any security and nothing herein should be construed as such. All investment strategies and investments involve risk of loss, including the possible loss of all amounts invested, and nothing herein should be construed as a guarantee of any specific outcome or profit. While we have gathered the information presented herein from sources that we believe to be reliable, we cannot guarantee the accuracy or completeness of the information presented and the information presented should not be relied upon as such. Any opinions expressed herein are our opinions and are current only as of the date of distribution, and are subject to change without notice. We disclaim any obligation to provide revised opinions in the event of changed circumstances.
The information in this material is confidential and proprietary and may not be used other than by the intended user. Neither Toroso or its affiliates or any of their officers or employees of Toroso accepts any liability whatsoever for any loss arising from any use of this material or its contents. This material may not be reproduced, distributed or published without prior written permission from Toroso. Distribution of this material may be restricted in certain jurisdictions. Any persons coming into possession of this material should seek advice for details of and observe such restrictions (if any).
