
By Chris Konstantinos, CFA, Director of Investments | Chief Investment Strategist
SUMMARY
- We think stocks care more about the economy than about politics.
- Last week’s elections will likely result in political gridlock.
- Lower inflation data is encouraging…but more is needed, in our view.
Last week showed that Stocks care more about the Fed and the economy than about Politics
Last week, US stocks rose almost 6% – much of it on Thursday – as investors simultaneously digested uncertain election results and lower-than-expected economy inflation data. RiverFront believes that the path of inflation and thus Fed policy will determine the direction of stocks over the near-to-intermediate term, not US politics. This was clearly illustrated by the fact that the markets reacted much more strongly to Thursday’s lower-than-expected inflation data than to Tuesday’s election malaise.
Political ‘Gridlock’ – Ugly, but not an Impediment for Economy Stocks Going Forward
First, a quick roundup of the midterms: after last week, Republicans appear to have retaken the House of Representatives – albeit by a smaller number than expected prior to the elections. Currently, the GOP officially control 211 House seats and Democrats have 204, according to a Wall Street Journal article from November 12. Dems are expected to win several more seats, but the odds appear low that they can hold onto the 218 needed for the majority. In the Senate, Democrats will retain control as close races in Nevada and Arizona both broke the Dem’s way when votes were tallied over the weekend.
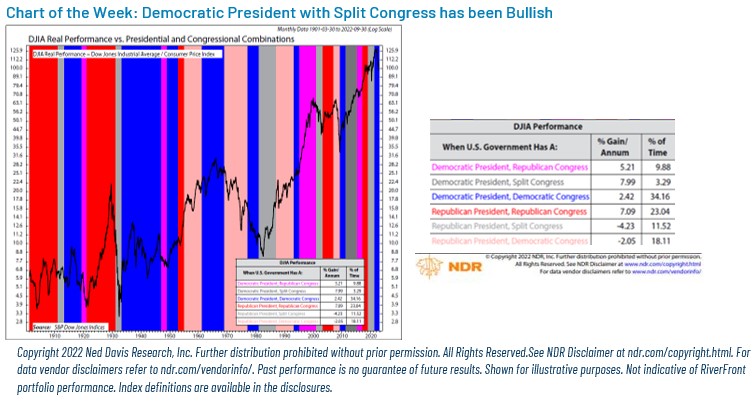
We believe the results will lead to a classic case of political ‘gridlock’, with neither political party emerging from the midterms wielding unilateral power. While economy gridlock will likely amplify the ugly divisiveness that has marked US politics for years, gridlock has historically been a positive outcome for stocks in the economy. This assertion is supported by a NDR Research analysis looking at returns on the Dow Jones Industrial Average (DJIA) going back over 120 years (see chart, next page).
When analyzing gain-per-annum percentages across the various political combinations in the executive and legislative branches, market gains adjusted for inflation were between roughly +5% and +8% per year with a combination of a Democratic President who wasn’t in control of Congress. This is true regardless of whether the two branches of Congress were split or were controlled solely by the GOP. We note that these combinations represent less than 15% of all historical cases, so the sample size may be too small to draw concrete conclusions. But at the very least, we don’t expect this political backdrop to be an impediment for markets going forward.
Should the Democrats also retain control of the House – a small but non-zero probability at this point– the historical track record for stocks is still positive, but with much lower absolute returns than gridlock (chart, next page).
This is not to say that there are no ramifications of deep political division. We believe fights on controversial topics such as abortion, energy policy, healthcare, taxes, or economy regulation will likely turn even more divisive. The typical debate over the debt ceiling– contentious in the best of times – may also be exacerbated by gridlock, leading to some potential ‘white-knuckle’ moments late next year, similar to 2011 or 2013. Political gridlock may also make it harder to pass a fiscal stimulus package if a deep recession comes. On the other hand, this dynamic may actually make the Fed’s job ‘easier’ in the sense that fiscal policy is unlikely to confound the Fed’s attempt to combat inflation.
Positive Surprise on Inflation: Good News…But Still a Long Way to Go for the Economy
Regardless of the results, just getting through the midterm elections will allow investors to refocus on their primary obsession…the future path of inflation and thus Federal Reserve policy. This was on full display in market action towards the end of last week, where stocks and major foreign currencies rallied dramatically on Thursday after the October headline Consumer Price index (CPI) report came in broadly lower than expectations at 0.44% month-over-month increase (estimates were for +0.6%). Core CPI was also a positive surprise at 0.27% month-over-month (expectations were for +0.5%). Importantly, not only was core inflation lower than expected, but also lower than the prior month.
Any good news is welcome on the inflation front, but we feel compelled to remind readers of some counterpoints here:
- Core services prices are still rising and even accelerated a bit over the past three months.
- The much-anticipated easing of shelter prices hasn’t happened yet.
- Gasoline prices also stopped falling in October.
- Wages on the Atlanta Fed’s Wage Growth Tracker showed no signs of weakening.
Fed Chairman Powell, as recently as two weeks ago, cautioned market participants against getting ahead of themselves on the likelihood of the Fed pivoting towards more expansionary policy. He stated it was ‘very premature…to be thinking about or talking about pausing our rate hike’ and that that the Fed was committed to ‘stay the course, until the job is done’ in order to avoid making the mistake of prematurely loosening policy, as happened at various points in the 1970s. In our view, it is premature to expect a single encouraging CPI print to fundamentally alter the Fed’s trajectory just yet, as inflation is still much higher than the Fed’s targets. According to the Cleveland Fed’s Nowcast November estimate, headline and core CPI year-over-year is trending at 7.6% and 6.3% for 2022, versus the Fed’s inflation forecast for 5.4% and 4.5%. To achieve the Fed’s published 2023 headline and core economy inflation forecasts, monthly inflation will have to average 23bps (bps = 1/100th of 1%) and 25.5bps next year…making last week’s report a ‘good start, but not quite there yet.’
Conclusion: We Remain Cautious, Watching Technical Levels Closely
We remain cautious overall and are under our long-term allocation targets for equities and over those targets for cash, specifically seeking to avoid international equities. Given the number of economies that are fighting inflation, we expect a global recession in the next 12-18 months. However, in keeping with our ‘process over prediction’ mantra, we must take seriously the recent improvement in the technical backdrop in the economy, even as we seek to place the current rally into broader economy context.
Global stocks, as represented by the ACWI All-Country World Index, are currently up roughly 13% from their October 12, 2022 low. Given big year-to-date losses, positive seasonality effects (Q4 is often the highest performing quarter of the year), and encouraging inflation data, we think this current market rally could have staying power. However, bear markets often experience short, sharp rallies that subsequently fail, going on to make new lows. According to Goldman Sachs, there has been 18 global bear market rallies since in the early 1980s; on average they last 44 days and the MSCI All-Country World return averages +10-15% before failing. Extreme volatility in markets in both directions makes timing tactical decisions especially challenging, so we are attempting to be as methodical as possible.
Our technical opinion of the market is mixed. The S&P 500 has retraced nearly 38% of its downtrend since January. From a technical perspective, a decisive break above 38% would represent the first concrete step in a bottoming process, in our opinion. We think it is important for the S&P to break above the 200-day moving average at 4,081 in order to get out of its recent trading range. We continue to respect our three trading rules of Don’t Fight the Fed, Don’t Fight the Trend, and Beware of the Crowd at Extremes. From a trend perspective, we think final confirmation that the market has indeed bottomed would likely require a breakout well above current levels at 4,300, which would represent the first meaningful higher high made since the bear market started. We view crowd sentiment as currently neutral, having worked off its pessimistic extremes in the most recent rally.
Risk Discussion: All investments in securities, including the strategies discussed above, include a risk of loss of principal (invested amount) and any profits that have not been realized. Markets fluctuate substantially over time, and have experienced increased volatility in recent years due to global and domestic economic events. Performance of any investment is not guaranteed. In a rising interest rate environment, the value of fixed-income securities generally declines. Diversification does not guarantee a profit or protect against a loss. Investments in international and emerging markets securities include exposure to risks such as currency fluctuations, foreign taxes and regulations, and the potential for illiquid markets and political instability. Please see the end of this publication for more disclosures.
Important Disclosure Information:
The comments above refer generally to financial markets and not RiverFront portfolios or any economy related performance. Opinions expressed are current as of the date shown and are subject to change. Past performance is not indicative of future results and diversification does not ensure a profit or protect against loss. All investments carry some level of risk, including loss of principal. An investment cannot be made directly in an index.
Information or data shown or used in this material was received from sources believed to be reliable, but accuracy is not guaranteed.
This report does not provide recipients with information or advice that is sufficient on which to base an investment decision. This report does not take into account the specific investment objectives, financial situation or need of any particular client and may not be suitable for all types of investors. Recipients should consider the contents of this report as a single factor in making an investment decision. Additional fundamental and other analyses would be required to make an investment decision about any individual security identified in this report.
Chartered Financial Analyst is a professional designation given by the CFA Institute (formerly AIMR) that measures the competence and integrity of financial analysts. Candidates are required to pass three levels of exams covering areas such as accounting, economics, ethics, money management and security analysis. Four years of investment/financial career experience are required before one can become a CFA charterholder. Enrollees in the program must hold a bachelor’s degree.
All charts shown for illustrative purposes only. Technical analysis is based on the study of historical price movements and past trend patterns. There are no assurances that movements or trends can or will be duplicated in the future.
All charts shown for illustrative purposes only. Technical analysis is based on the study of historical price movements and past trend patterns. There are no assurances that movements or trends can or will be duplicated in the future.
Ned Davis Research (NDR) is a global provider of independent investment research, solutions and tools. Founded in 1980, NDR helps clients around the world make objective investment decisions.
Stocks represent partial ownership of a corporation. If the corporation does well, its value increases, and investors share in the appreciation. However, if it goes bankrupt, or performs poorly, investors can lose their entire initial investment (i.e., the stock price can go to zero). Bonds represent a loan made by an investor to a corporation or government. As such, the investor gets a guaranteed interest rate for a specific period of time and expects to get their original investment back at the end of that time period, along with the interest earned. Investment risk is repayment of the principal (amount invested). In the event of a bankruptcy or other corporate disruption, bonds are senior to stocks. Investors should be aware of these differences prior to investing.
In general, the bond market is volatile, and fixed income securities carry interest rate risk. (As interest rates rise, bond prices usually fall, and vice versa). This effect is usually more pronounced for longer-term securities). Fixed income securities also carry inflation risk, liquidity risk, call risk and credit and default risks for both issuers and counterparties. Lower-quality fixed income securities involve greater risk of default or price changes due to potential changes in the credit quality of the issuer. Foreign investments involve greater risks than U.S. investments, and can decline significantly in response to adverse issuer, political, regulatory, market, and economic risks. Any fixed-income security sold or redeemed prior to maturity may be subject to loss.
Index Definitions:
Standard & Poor’s (S&P) 500 Index measures the performance of 500 large cap stocks, which together represent about 80% of the total US equities market.
The MSCI All Country World Index (ACWI) is an economy stock index designed to track broad global equity-market performance. Maintained by Morgan Stanley Capital International (MSCI), the index comprises the stocks of nearly 3,000 companies from 23 developed countries and 24 emerging markets.
The Consumer Price Index (CPI) is a measure that examines the weighted average of prices of a basket of consumer goods and services, such as transportation, food, and medical care. It is calculated by taking price changes for each item in the predetermined basket of goods and averaging them. Changes in the CPI are used to assess price changes associated with the cost of living. The CPI is one of the most frequently used statistics for identifying periods of inflation or deflation.
The Dow Jones Industrial Average (DJIA), also known as the Dow 30, is a stock market index that tracks 30 large, publicly-owned blue-chip companies trading on the New York Stock Exchange (NYSE) and Nasdaq.
Definitions:
A basis point is a unit that is equal to 1/100th of 1%, and is used to denote the change in a financial instrument. The basis point is commonly used for calculating changes in interest rates, equity indexes and the yield of a fixed-income security. (bps = 1/100th of 1%)
The 200-day moving average is a popular technical indicator which investors use to analyze price trends. It is simply a security’s average closing price over the last 200 days.
Don’t Fight the Fed – ‘Supportive’ means the Fed’s monetary policy regarding inflation and employment is in what we believe based on our analysis to be the investors’ best interest; ‘Against’ means the Fed’s monetary policy, in our view, is going against the investors’ best interest; ‘Neutral’ means the Fed’s monetary policy is neither supportive or against the investors’ best interest in our view. Don’t Fight the Trend – Terms correlate to the 200-day moving average as it relates to the equity indexes: ‘Positive’ means that the trend is rising, ‘Flat’ means the trend is flat, ‘Negative’ means the trend is falling. Beware the Crowd at Extremes – Terms correlate to the NDR Crowd Sentiment Poll and its measurement of Extreme Optimism (Bearish), Neutral, or Extreme Pessimism (Bullish).
RiverFront Investment Group, LLC (“RiverFront”), is a registered investment adviser with the Securities and Exchange Commission. Registration as an investment adviser does not imply any level of skill or expertise. Any discussion of specific securities is provided for informational purposes only and should not be deemed as investment advice or a recommendation to buy or sell any individual security mentioned. RiverFront is affiliated with Robert W. Baird & Co. Incorporated (“Baird”), member FINRA/SIPC, from its minority ownership interest in RiverFront. RiverFront is owned primarily by its employees through RiverFront Investment Holding Group, LLC, the holding company for RiverFront. Baird Financial Corporation (BFC) is a minority owner of RiverFront Investment Holding Group, LLC and therefore an indirect owner of RiverFront. BFC is the parent company of Robert W. Baird & Co. Incorporated, a registered broker/dealer and investment adviser.
To review other risks and more information about RiverFront, please visit the website at www.riverfrontig.com and the Form ADV, Part 2A. Copyright ©2022 RiverFront Investment Group. All Rights Reserved. ID 2591683
