
The Four Stages to Putting in a New Portfolio High
By Canterbury Investment Management
Navigating a volatile market requires a disciplined approach. In a recent video, Canterbury discusses the Four stages of adapting to a volatile market and putting in a new portfolio high:
Market Update
There is no question that the markets have been volatile since late February. The S&P 500 saw a new all time high, with low volatility, back on February 19th. One month later, the S&P 500 is down -34%. That 23-day downturn featured 18 outlier days (days beyond +/-1.50%), ranging anywhere from -12% to +9%. These types of trading day are not only statistically impossible according to bell curve math, but all occurred back-to-back-to-back.
Anytime you see a large market downturn fueled by emotion and irrational behavior, it is usually followed by an equally emotional rally. That is why following a -34% drawdown in 23 days, the S&P 500 rallied +34% in 25 days, regaining half of the overall decline. That rally also featured 18 outlier days.
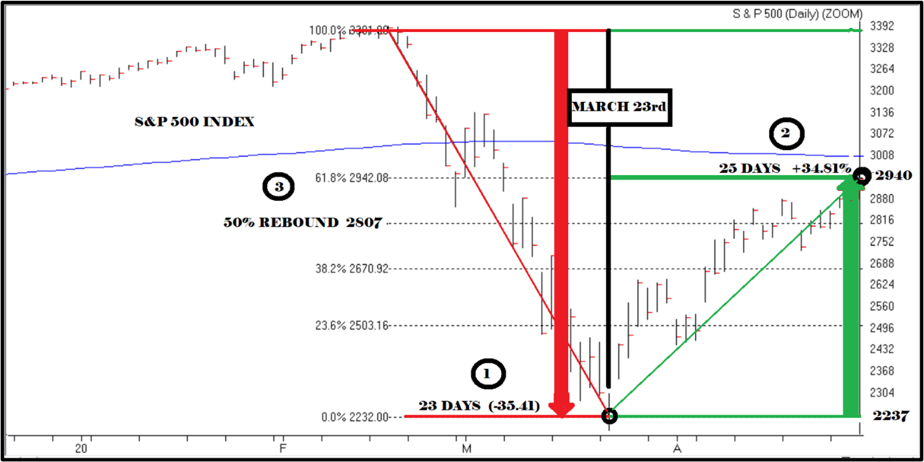
Chart 1: S&P 2020 Decline & Rally, Source: AIQ

Chart 2: Start of the Financial Crisis, Source: AIQ
The chart above shows the S&P 500 during the first part of the financial crisis. The lower half of the chart shows trading volume. Volume is the total amount of shares traded of a security throughout a day. High volume shows conviction among traders and lower volume shows a little bit more of uncertainty. Volume is typically higher in bear markets and lower in bull markets.
During the first part of the financial crisis, you will notice that at segments A, B, C, and D there are declines. During those declines, there is increased volume. The subsequent rallies that followed experienced lower volume prior to once again declining.
The recent market rally occurred on lower volume. The initial drawdown experienced a high degree of volatility, and increased volume. The rally back has still seen volatility, but declining volume.

Chart 3: S&P 2020 Decline & Rally with Volume, Source: AIQ
Bottom Line – Is this a bear market?
There are two main components to a bear market: drawdown and time. There will typically be a series of lower highs and lower lows over an extended period.
According to a study by Charles Schwab, bear markets on average take about a year and half to get from peak to trough (plus much longer to get back to breakeven) and have a maximum decline averaging about 40%.
Looking back at Chart 2, during the first leg of the financial crisis, from the peak of the market in October of 2007 (start of segment B) to point E, there was a 20% decline and a 50% recapture of the loss. This whole process took 8 months to occur. So far, we have seen a -34% drawdown and more than a 50% retracement in just 2 months.
Typically, bear markets have been defined in conventional wisdom as a 20% decline in value. While we have seen a 20%+ decline in the markets, it has occurred over a very short timeframe and could end up being another trading anomaly. Remember, the percentage decline is not as important as the time it takes to get back to breakeven. It is not a bear market if the market drops 25% and gains it all back in a month, for example.
Regardless of whether this is just another trading anomaly or the first phase of a bear market, we have seen an unparalleled drop and rally in the markets, coupled with high volatility. Just as the drop was not sustainable, a sharp market rally most likely will not be sustainable either. To adapt to this, the Portfolio Thermostat waited for the kickback rally to occur, and then added defensive positions to help stabilize the portfolio should the market decline to lower levels from here.
This article was submitted by Canterbury Investment Management, a participant in the ETF Strategist Channel.
