
By Brandon Bischof, CMT, Canterbury Investment Management
Market State 6 (Transitional): It has been a wild week in the equity markets. Just 6 trading days ago, the S&P 500 was sitting at a new high, with low volatility. Last week, it felt like a trap door opened, and the market fell right through it. The reason? Well, the Coronavirus certainly has people freaked out.
If we look at history and take a 30,000-foot view of where society is today, versus where it was 100, 200, 1000 years ago, there have been many advancements in technology, transportation, applications, medicine, etc. There is one thing, however, that hasn’t changed: Human Emotion.
All liquid traded markets/securities follow the law of supply and demand. Supply and demand are counterintuitive, often doing the opposite of what most people expect. Supply and demand are driven by investors emotions and beliefs about the future. Sometimes, these emotions can overtake logic and reason, causing a market event similar to what we are seeing right now.
We have seen a few instances similar in recent history. Trading anomalies such as the one that occurred in December of 2018, or the Flash Crash in 2010, had many similar qualities to the current state of the market. In December of 2018, the market was within the range of a normal bull market correction but fell an additional 10% over the course of 7 days. The market then rallied back in the next two weeks, and ultimately put in a new all-time high a few months later. In the Flash Crash of 2010, the S&P 500 fell -10% during one trading day (Proctor and Gamble actually fell by -25%) but rallied off those lows before the close of the bell.
The point that I am trying to make is that markets can do many crazy things because people can be emotional and make irrational decisions. Many studies show that markets do not go from a bull market to bear market with the snap of a finger. There has to be a process.
Canterbury Volatility Index (CVI)- CVI 99: Volatility sharply increased over the course of last week, as we saw 4, almost 5, outlier days right in a row. These outlier days all had a wide array emotion. Check the market one hour, and then check it again 15 minutes later, and it was probably in a much different spot. Once markets become emotional, it takes time for them to figure out exactly where they want to be. These outlier days are rarely ever evenly dispersed, and more often occur back-to-back-to-back.
On a bright note, volatility works both ways. Last week saw 5 large down days, but there will also be large “up days” with higher volatility. In fact, even in a real bear market like the one seen during the financial crisis, 42% of the outlier days (days beyond +/-1.50%) were actually “up days”, and volatility was much higher during that time than it is right now.
Quick observation:
Looking at short-term volatility (a 10-day, fast moving CVI) over recent history, we can see that short-term volatility often reaches its highest point at market lows, after large sell-offs. You can see in the chart below, that each time in recent history that short-term volatility has reached, or come close to reaching CVI10-day 200, the market has rallied back.

Comment
Even with the recent volatility spikes in the market, there are still a few technical positives to take away.
#1: Advance/Decline Line
At the time that the S&P 500 reached a peak on February 19th, the Advance Decline Line, which measures market breadth, was also near a new high. This means that rather than the market being carried by a select few stocks during the uptrend, there was broad participation. In the bear markets of both 2000 and 2008, the market was putting in new highs, while the A/D Line was falling. This was not the case at the market top in mid-February
#2 Stocks are oversold
Our good friend and Market Technician, David Vomund, says that stocks are currently oversold, indicating a buy signal. He wrote in his weekly update:
The percentage of stocks giving AIQ [potential]buy signals is at 97%, a deeply oversold reading.
#3 Nasdaq is still leading the S&P 500
Typically, during bull markets we like to see the Nasdaq (technology) outperforming the S&P 500 on a relative basis, indicating that investors are willing to take on a perceived higher level of risk. Up through the beginning of February, this was true, the Nasdaq was leading the market. One would expect that during a sharp selloff, like the one we saw last week, that the Nasdaq would be leading the selloff. However, even in the sharp decline, the Nasdaq’s weekly relative strength versus the S&P 500 remained positive, which is a positive sign for the market.
On an interesting note, China, which is said to be the source of the Coronavirus, outperformed the US markets on a relative basis last week. Even while global markets were hitting lows, China did not reach new lows.
Portfolio Efficiency
The Canterbury Portfolio Thermostat does not aim to compete against any individual index or blended benchmark. We know that portfolio efficiency is a moving target, and all asset classes will go in and out of favor. The Portfolio Thermostat is an Adaptive Portfolio Strategy designed to navigate various markets and create an efficient portfolio for today’s environment- Bull or Bear.
Canterbury benchmarks its portfolio against key “internal” metrics, in order to measure portfolio efficiency. These metrics are Portfolio State, Portfolio Volatility, and Portfolio Benefit of Diversification. Together, these internal benchmarks create the Portfolio Efficiency Score.
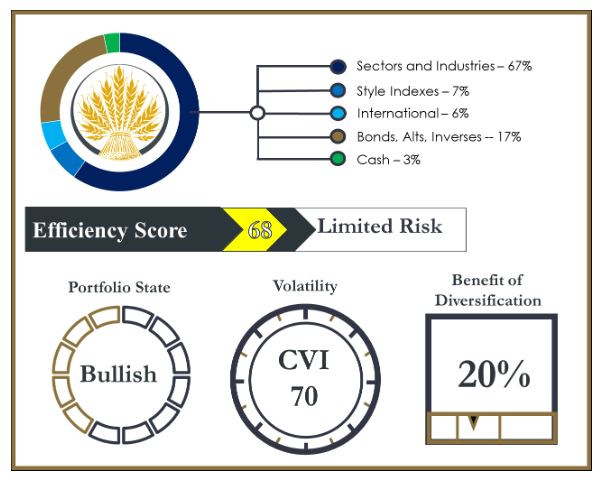
You can see that the Portfolio Thermostat is temporarily transitional. This is due to the type of market environment we are currently seeing. We are experiencing similar events to what we saw back in December of 2018. If you recall, this was typical of a trading anomaly. During market trading anomalies, which are quick, sharp drops, followed by snapbacks, it is important to not make the portfolio immediately efficient.
During highly emotional anomalies, there will be inevitable kickback rallies. By making the portfolio immediately efficient, and stabilizing volatility through increasing the benefit of diversification, you can make the fatal mistake of getting whipsawed: having more exposure on the way down, and less or no exposure on the kickback rallies. The market does not know where it wants to be, that is why we are seeing a wide array of outlier days. As we navigate the ups and downs of this volatile trading environment, we can make adjustments to make the portfolio more efficient as the market figures out exactly where it wants to be.
Bottom Line
Last week, as well as the start of this week, have been highly emotional. It feels like December 2018 all over again. I am not a doctor and cannot give any indication to how serious the Coronavirus is relative to the common flu or even Ebola, but the type of market environment we saw last week seems more common of a trading anomaly. People get nervous, and then become emotional causing a quick, irrational sell-off. From a portfolio management perspective, it is crucial to not immediately take harsh actions, or trying to play into an irrational market. Especially since we were sitting at a new all-time high 7 days ago.
Given the wide range of volatility, there were still a few positives to take away: the Nasdaq is still leading the S&P 500, stocks are now extremely oversold and could be a technical “buy” signal, and the Advance Decline Line was not showing any major signs of diverging.
This article was submitted by Canterbury Investment Management, a participant in the ETF Strategist Channel.
