
From Richard Bernstein Advisors
Every instance of financial speculation today is termed a “bubble”, but true financial bubbles are rarer than most investors believe.
Certainly, bubbles include speculation, but the difference between bubbles and mere speculative periods is that bubbles go beyond the financial markets and pervade society.
As we’ve highlighted in past Insights, there are five defining characteristics beyond speculation that are common to historical financial bubbles:1
- Increased use of leverage.
- Increased liquidity.
- Democratization of the market.
- Record new issues.
- Record turnover.
These characteristics seem to be spreading in several markets these days. The technology sector, venture capital, private equity, and distressed debt all show several of these characteristics. Their performance comparisons to other markets are getting extreme and, as in most bubbles, investors’ enthusiasm for the asset classes is growing as those performance disparities get wider. Bubbles tend to significantly hurt the performance of contrarian investors, and this cycle has fit that pattern.
We thought it worthwhile to highlight some of these significant disparities.
Many observers have pointed out that the US corporate sector’s leverage ratios have increased significantly. Chart 1 shows that public company leverage has indeed increased but does not look dire relative to history. Individual sectors have increased leverage (i.e., Consumer Staples, Health Care, and Technology), but public equity leverage ratios in general still look conservative relative to history. One should have expected leverage ratios to increase as interest rates fell because companies simply refinanced and expanded debt levels while keeping interest payments at similar levels.

Leverage ratios among public companies have increased, but leverage ratios among private companies has ballooned. According to Empirical Research Partners, Debt-to EBITDA for private companies is more than double that of the S&P 500® (see Chart 2). Investors often point to the higher returns associated with private companies but fail to mention those companies tend to be more cyclical and more highly levered than is the overall public market.

Liquidity
The days of a stern Chair of the Federal Reserve are long gone. The late Paul Volkers’ strict monetary policies have been followed by a series of Fed Chairman who have fostered increasingly expansive monetary policies and haven’t understood or cared that loose monetary policy causes inflation if not in real assets, then in financial assets. Since the early-1990s, real asset inflation has been largely constrained by globalization, so the Fed’s ongoing free-flowing liquidity created a series of financial asset bubbles.
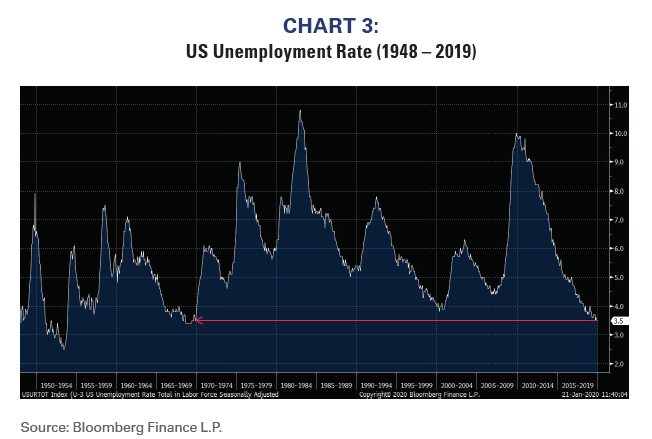
The Fed has a dual mandate of low unemployment and stable prices. The Fed cut interest rates three times during 2019 and began to once again expand its balance sheet despite that the economy was healthy and despite that the unemployment rate was at a 50-year low (See Chart 3). That implies the Fed believed that deflation was a risk and wanted more inflation. Unfortunately, they failed to yet again recognize that loose monetary policy can cause inflation in financial assets.
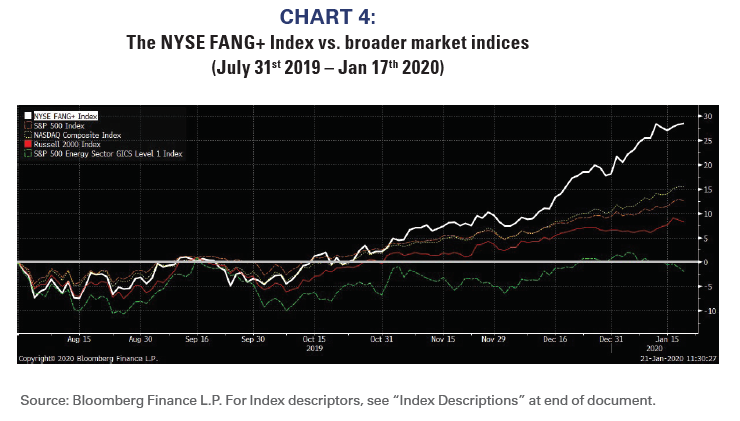
The result of the recent lowering of rates and expansion of the Fed’s balance sheet has been a bubble in the making. Since the Fed cut rates last July, just one segment of the Technology sector has significantly outperformed the overall market (See Chart 4).
Democratization of the market
Bubbles pervade society. Therefore, perhaps the most defining aspect of a bubble is the democratization of the market, i.e., everyone should get to play. The birth of the online day-trader during the tech bubble and people
flipping condos and leaving good jobs to become real estate agents during the housing bubble are two examples.
It was especially disconcerting to recently read that major private equity and venture capital firms were heavily lobbying regulators to allow individuals
to invest in private markets. First, this seems to totally ignore the history of individuals’ unfortunate experiences with private markets and why today they do not have access. Second, it seems to ignore the vast amounts of “dry powder” or funds that have been raised for private equity and venture investing that have yet to be called (over $2 trillion by some reports).
Individuals are being offered entry at a very late stage. Third, it also ignores that recent flows to private equity and venture have eclipsed the historic flows into public equity mutual funds during the technology bubble. Fourth, and perhaps most important, it reflects the standard refrain during bubbles that everyone should get to play and denying individual investors access to a market hinders their wealth creation.
Record new issues
Although the IPO market may have recently fizzled, the combination of unbridled creation of new private and venture funds and the overall plentiful availability of speculative capital should warrant caution.
Bubbles divert capital away from productive use, and there are many current examples of such ill-advised allocations. Investors’ long-term returns are always higher when capital is scarce, and bubbles create scarcities in non-bubble industries or sectors. Our now famous (infamous?) report from March 2000 “Attention Venture Capitalists: Leave Silicon Valley for West Texas” reflected how the energy sector was starved for capital and that returns on capital were likely to be higher in the energy sector than in the bubble-financed technology sector.
For example, today there are companies with lofty valuations that:
- Will take wealthy individuals on outer-space vacations.
- Will dominate the auto industry without distribution, without sufficient cash flow, and with competition building.
- Are the modern day “conglomerates”. Business school case studies often center on “stick to your knitting” and the failure of the conglomerate model, but today’s conglomerates are assumed to be immune.
- Exist in product markets that are rapidly fragmenting with little competitive advantage to differentiate any company.
- Etc., etc., etc…
Another way to measure “new issues” is the shares outstanding for ETFs. When the shares outstanding increase it reflects higher demand for the ETF. Chart 5 shows the shares outstanding of the two largest technology sector ETFs. Both ETFs’ shares outstanding increased during 2019.

Record Turnover
Admittedly, it is virtually impossible to measure turnover or trading volume for private investments largely because they do not trade. Illiquidity among private investments is often considered a positive factor because the added risk should be compensated with added returns. Whereas there might have been a significant illiquidity premium in private investments 25 years ago when few investors were interested in private investments, we strongly doubt that premium exists today.
If it quacks like a bubble…
Many, if not all, of the characteristics of a financial bubble seem evident in some technology or “disruptor” shares, private equity, and venture capital. One can never predict when a bubble might deflate. However, it seems relatively clear to us that investors should not be adding positions in such frothy sectors.
Don’t miss out on future RBA Insights, subscribe today.
To learn more about RBA’s disciplined approach to macro investing, please contact your local RBA representative.
INDEX DESCRIPTIONS:
The following descriptions, while believed to be accurate, are in some cases abbreviated versions of more detailed or comprehensive definitions available from the sponsors or originators of the respective indices. Anyone interested in such further details is free to consult each such sponsor’s or originator’s website.
Indexes are not available for direct investment.
The past performance of an index is not a guarantee of future results.
NYSE FANG+: The NYSE FANG+ Index is an equal-dollar weighted index designed to represent a segment of the technology and consumer discretionary sectors consisting of highly-traded growth stocks of technology and tech-enabled companies such as Facebook, Apple, Amazon, Netflix, and Alphabet’s Google.
S&P 500®: The S&P 500® Index is an unmanaged, capitalization- weighted index designed to measure the performance of the broad US market. The index includes 500 leading companies covering approximately 80% of available market capitalization.
Russell 2000: Russell 2000 Index. The Russell 2000 Index is an unmanaged, market-capitalization-weighted index designed to measure the performance of the small-cap segment of the US equity universe. The Russell 2000 Index is a subset of the Russell 3000® Index.
Sector/Industries: Sector/industry references in this report are in accordance with the Global Industry Classification Standard (GICS®) developed by MSCI Barra and Standard & Poor’s.
About Richard Bernstein Advisors
Richard Bernstein Advisors LLC is an investment manager focusing on long-only, global equity and asset allocation investment strategies. RBA runs ETF asset allocation SMA portfolios at leading wirehouses, independent broker/dealers, TAMPS and on select RIA platforms. Additionally, RBA partners with several firms including Eaton Vance Corporation and First Trust Portfolios LP, and currently has $9.3 billion collectively under management and advisement as of December 31st, 2019. RBA acts as sub‐advisor for the Eaton Vance Richard Bernstein Equity Strategy Fund, the Eaton Vance Richard Bernstein All‐Asset Strategy Fund and also offers income and unique theme‐oriented unit trusts through First Trust. RBA is also the index provider for the First Trust RBA American Industrial Renaissance® ETF. RBA’s investment insights, as well as further information about the firm and products, can be found at www.RBAdvisors.com.
