
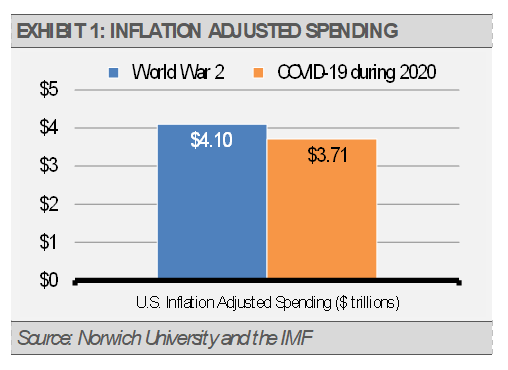
Between the massive fiscal response and dramatic monetary policy actions, we think that the U.S. government’s response to the economic consequences of the COVID-19 pandemic will ultimately be judged as the largest economic stimulus in our history based on total inflation-adjusted dollars. For example, consider the inflation adjusted dollars that the federal government spent over the entirety of World War II and the single year 2020 fiscal response to the COVID-19 pandemic. The U.S. spent roughly $4.1 trillion over the nearly four years of direct involvement in World War II. In 2020 alone, the federal government already spent over $3.7 trillion with more likely to come in 2021. The monetary response from the U.S. Federal Reserve (the Fed) has been significant as well with approximately $3 trillion of asset purchases and other facilities made available in response to the pandemic.
In addition, while we do not expect significant legislative change from Washington, DC, we do expect additional COVID-19 support. Even with unified control of the House, Senate, and the Whitehouse, administrations typically only get one or two major policy initiatives enacted. For example, Obama got his health care initiative enacted and Trump enabled tax cuts. Both administrations were able to make further adjustments to regulations in individual industries, but gridlock soon blocked macro policy initiatives.
We think that there is a large faction of moderates in both parties who will keep things on an even keel. At the same time, we do expect to see additional bipartisan fiscal support in the form of more COVID-19 relief as well as infrastructure spending. We anticipate such massive intervention to have profound financial market consequences in terms of stock and bond prices, commodities, and inflation.
Furthermore, we see continued strength in many fundamental leading economic indicators. While the recent uptick in COVID-19 cases may have stoked investors’ fears, the data suggests that selective lockdowns and better treatments have led to better outcomes and minimal broad economic impact. It appears that businesses and some local governments are starting to learn how to adjust to spikes and that mask mandates and other steps to protect the most vulnerable have prevented mass lockdowns.
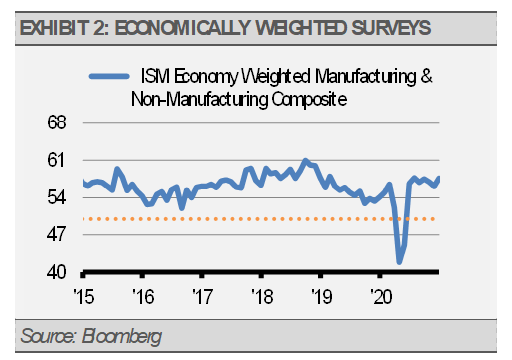
For example, the economically weighted Purchasing Manager Index (PMI) increase from November to December was propelled by advances in both the manufacturing and service sectors. As a reminder, PMI readings below 50 suggest economic contraction while readings above 50 suggest economic growth. As the following graph suggests, the latest PMI results have been pointing to solid growth. Importantly, new orders, or new business pipelines, continue to be strong as well, which bodes well for further economic gains ahead.
Lastly, the Fed’s new and more patient stance on monetary policy regarding inflation risks should leave the economy with more room to run. Previously, the Fed had an inflation target of 2% which they changed to an average of 2% last year. This means that they will allow inflation to increase to a rate above 2% for some period of time and not be so quick to start tightening monetary policy in anticipation of an uptick in inflation. We expect the Fed to wait until they see inflation firmly above 2% before significantly tightening monetary policy. As a result of our strong economic growth expectation over the balance of 2021, combined with ongoing fiscal and monetary support, we expect inflation rates higher than we have seen since before the Global Financial Crisis.
As the following graph illustrates, liquidity, as measured by Money Zero Maturity (MZM), and total savings increased dramatically because of fiscal and monetary support combined with the economic recovery we have seen thus far. This excess in liquidity and savings should work its way into the real economy as improved therapeutics and broader vaccine distribution over the coming months allow the economy to regain its footing.

The temporary collapse in prices in the early stages of the pandemic last year means that headline and core inflation will likely rise in the coming months as prices normalize.
Going from a brief deflationary period last spring to any inflation this year may produce a temporary surge in the headline inflation rate. We think this will lead to somewhat higher long-term interest rates that could result in a change in stock market leadership and a challenging environment for long-term bond prices.
Overall, the economic backdrop looks promising. Despite near-term softness related to the pandemic, our most sensitive leading indicators, such as liquidity growth, inflation expectations, and the prices of industrial metals, continue to point to solid economic growth ahead. Even accounting for a soft economic start to the year, we expect real GDP growth to be near 5% for the full year. Nominal GDP growth, which includes inflation and closely correlates with corporate revenue growth, should be about 7% for the year.

INVESTMENT IMPLICATIONS
We have systematically adjusted our Strategies to benefit from these implications and to protect from potential negative fallout. Our work suggests that the year ahead will likely bring rising stock market prices, higher long-term bond yields, and somewhat higher inflation. This should result in falling long-term bond prices and a stock market that is led by many of the sectors and countries that lagged in 2020.
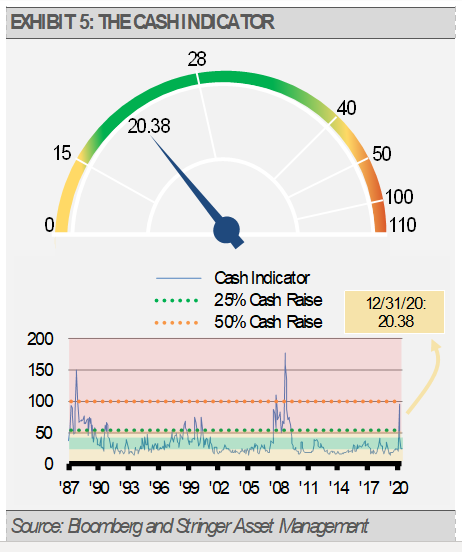
THE CASH INDICATOR
Our Cash Indicator (CI), which has been helpful in navigating market selloffs, is holding at a below average level. The current CI level suggests that the markets are functioning better with sufficient liquidity. As a result, diversification across asset classes should be our best means of risk management.
Originally published by Stringer Asset Management
DISCLOSURES
Any forecasts, figures, opinions or investment techniques and strategies explained are Stringer Asset Management, LLC’s as of the date of publication. They are considered to be accurate at the time of writing, but no warranty of accuracy is given and no liability in respect to error or omission is accepted. They are subject to change without reference or notification. The views contained herein are not to be taken as advice or a recommendation to buy or sell any investment and the material should not be relied upon as containing sufficient information to support an investment decision. It should be noted that the value of investments and the income from them may fluctuate in accordance with market conditions and taxation agreements and investors may not get back the full amount invested.
Past performance and yield may not be a reliable guide to future performance. Current performance may be higher or lower than the performance quoted.
The securities identified and described may not represent all of the securities purchased, sold or recommended for client accounts. The reader should not assume that an investment in the securities identified was or will be profitable.
Data is provided by various sources and prepared by Stringer Asset Management, LLC and has not been verified or audited by an independent accountant.
Index Definitions:
S&P 500 Index – This Index is a capitalization-weighted index of 500 stocks. The Index is designed to measure performance of a broad domestic economy through changes in the aggregate market value of 500 stocks representing all major industries.
